


Popular 2023 Posts on Two of Our Economics Blogs
In 2023, the Federal Open Market Committee (FOMC) raised the target range for the federal funds rate four times, which brought the key policy rate to a range of 5.25%-5.5%. Many measures of inflation continued to decline from their peaks in 2022. The labor market remained strong, with the unemployment rate staying below 4% throughout the year.
These are some of the economic developments this year. Perhaps it is no surprise that readers of our blogs were interested in posts examining inflation trends, wage growth, and the impact of rising interest rates on banks’ investment portfolios, among other topics.
Below are some of the most popular posts that were published in 2023 on these two St. Louis Fed blogs:
- On the Economy, which offers frequent analysis and data from our economists and other St. Louis Fed experts
- Open Vault, which explains everyday economics and the Fed
Inflation and Wage Growth
Is Inflation on the Way Out or Here to Stay?
While inflation declined in 2023, it had continued to be above the Federal Reserve’s inflation target of 2% as of the date of this blog post. But is the end of above-target inflation near, or will inflation settle above 2%? Economist Fernando M. Martin shed light on this question in his Oct. 19 On the Economy blog post, which was the latest in his series on inflation. He examined some measures of inflation through August; a few are shown in the chart below.
He noted that deflation in certain goods had helped bring overall inflation down, but inflation in core services had yet to show a marked and sustained deceleration at the time of his analysis. He discussed some risks that could delay or potentially reverse the decline in overall inflation.
Annualized Inflation Rates

SOURCES: Bureau of Economic Analysis and Haver Analytics.
Inflation, Disinflation and Deflation: What Do They All Mean?
You may have heard the term “disinflation” used in discussions of U.S. inflation trends since mid-2022. What does it mean, and how does it differ from inflation and deflation?
In an Aug. 23 Open Vault blog post, research associate Cassandra Marks explained that inflation is a sustained increase in the price level of goods and services, disinflation is a decrease in the rate of inflation, and deflation is a sustained decrease in the price level of goods and services. She also discussed examples of each (see the animation below), explored some causes of a fluctuating price level, and looked at how the effects of disinflation and deflation differ.
Nominal Wage Growth at the Individual Level in 2022
Who experienced the most and the least nominal wage growth between 2021 and 2022? Economist Victoria Gregory and then-research associate Elisabeth Harding explored this question in their Feb. 23 On the Economy blog post, the first of a two-part series.
They found that the median nominal wage growth rate was positive for each of the income groups they examined. Furthermore, workers in the lowest wage groups experienced some of the highest nominal wage growth rates, while those in the highest wage groups saw lower nominal wage growth.
But what about when inflation is taken into account? Gregory and Harding explored real (i.e., inflation-adjusted) wage growth at the individual level in 2022 in their second post, which was published March 27.
The authors found that 54% of workers had negative real wage growth in 2022—that is, their nominal wage growth didn’t keep up with inflation. However, they noted that young workers, low-income workers and job switchers tended to fare better than others because their nominal wage growth was higher than average.
State of the Economy
What Is the Probability of a Recession? The Message from Yield Spreads
Statistical models using yield spreads can provide estimated odds of a future recession. In a Sept. 7 On the Economy blog post, economist Christopher J. Neely used a statistical model to calculate probabilities of a U.S. recession in 12 months based on a nominal yield spread and on a real yield spread. (For his measure of the yield spread, he used the difference between 10-year and three-month Treasury rates.)
“One should take recession forecasts with a grain of salt and look at a variety of indicators, because even if a model were literally correct instead of an approximation, these models predict 40%, 50%, 60% probabilities of recessions, which means there is a fair likelihood of a soft landing,” Neely cautioned. “In addition, one should remember that forecasting relations can and do break down. Past success doesn’t guarantee future results. Information from other sources can give us greater confidence in, or suggest skepticism about, the yield curve forecasts.”
(Want to read about a potential “soft landing” for the U.S. economy? See the Sept. 1 On the Economy blog post by economist Paulina Restrepo-Echavarria and then-research associate Praew Grittayaphong, “Is a Soft Landing Possible? What the Beveridge Curve Reveals,” and the July 13 On the Economy blog post by economist Serdar Birinci and research associate Trần Khánh Ngân, “A Hard or Soft Landing? The Answer May Lie in the Beveridge Curve.”)
Beyond GDP: Three Other Ways to Measure Economic Health
Gross domestic product (GDP) and changes in GDP are popular indicators of economic output. But GDP is an imperfect measure of a country’s overall economic well-being, Grittayaphong wrote in an April 19 Open Vault blog post.
She provided an overview of three alternative measurements of economic well-being that some organizations and agencies look at: the Human Development Index, Better Life Index and Genuine Progress Indicator. Such measures weigh factors like residents’ health and education.
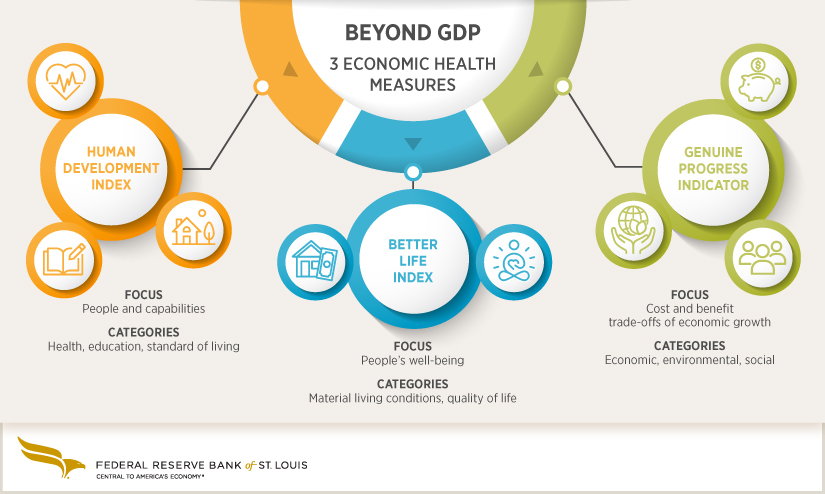
Three economic health measures beyond GDP: The Human Development Index focuses on people and capabilities, the Better Life Index focuses on people’s well-being, and the Genuine Progress Indicator focuses on cost and benefit trade-offs of economic growth.
Money and Banking
Rising Interest Rates Complicate Banks’ Investment Portfolios
Carl White, senior vice president in charge of banking supervision at the St. Louis Fed, discussed risks that rising interest rates were posing for bankers in a Feb. 9 On the Economy blog post.
“While rising interest rates give banks opportunities to increase earnings by pushing up rates charged on loans, they also could increase the cost of liabilities and decrease the value of investment securities held as assets,” he wrote. “Even unrealized losses—paper losses—in investment portfolios can have negative effects on liquidity and present funding challenges, earnings pressures and, in some cases, issues with capital.”
This blog post is part of the series titled “Supervising Our Nation’s Financial Institutions.” Another post in the series, which published July 6, discussed how remote work, higher interest rates and other factors have made commercial real estate lending more challenging for banks, particularly community banks.
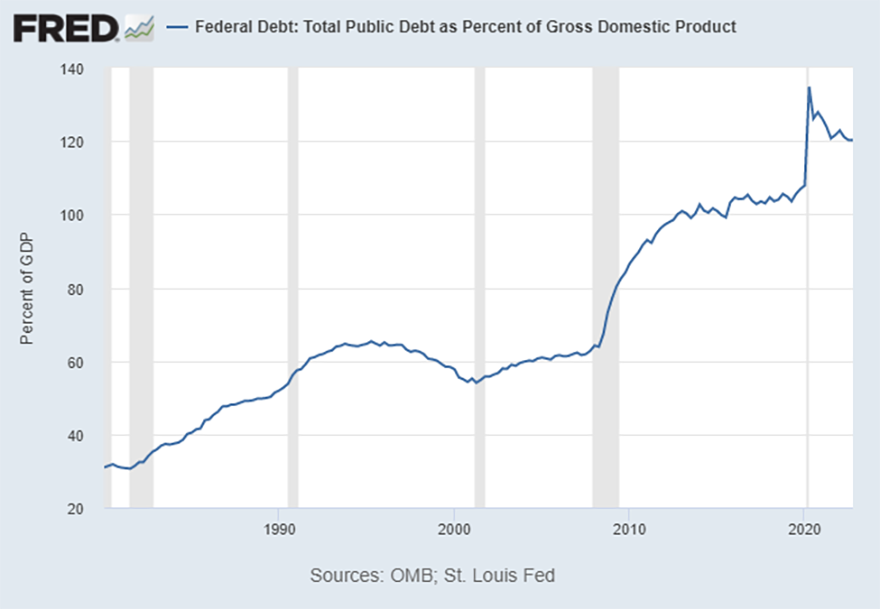
What Does History Reveal about Reducing the National Debt Burden?
U.S. national debt has increased over the past 20 years, and the U.S. debt-to-GDP ratio is around 120%, as shown in the FRED graph below.
In an April 6 On the Economy blog post, economist YiLi Chien and research associate Ashley H. Stewart looked at the U.S. national debt since World War II to gain insights about how the U.S. could reduce its debt-to-GDP ratio. They noted that economic growth and fiscal austerity (i.e., spending cuts and raising taxes) are two factors that helped reduce the country’s debt burden from 1945 to 1974.
Women’s History in the Treasury and on U.S. Money

Sacagawea, the Shoshone guide of the 1804-1806 Lewis and Clark expedition, is featured on a U.S. dollar coin issued in 2000. Image courtesy of the U.S. Mint.
When do you first remember seeing a woman’s image on U.S. currency? You might recall the Susan B. Anthony dollar coin released in 1979 or the Sacagawea “golden dollar” coin released in 2000. Long before then, Martha Washington’s portrait appeared on the 1886 and 1891 series of one-dollar silver certificates.
A March 1 Open Vault blog post by external communications writer Heather Hennerich highlighted some of the prominent women who have appeared on U.S. money going back to the late 1800s. The post also discussed women’s history in the Treasury Department, which extends to 1795 and includes recent historic leadership roles.
Five Things to Know about FedNow, Right Now
The Federal Reserve is making real-time payments available to banks and credit unions of any size with FedNow®, a new instant payments service that launched in July 2023. An Oct. 4 Open Vault blog post by external communications writer Laura Taylor discussed this new service as well as why fast and convenient payments are important for American households and businesses.
In addition to explaining what FedNow is, the post addressed questions about how “real-time” payments work, whether FedNow is replacing cash since it’s a digital payments system, and more.
Demographic Trends
The End of Rapid Population Growth
The world’s population doubled from 2 billion in 1928 to 4 billion in 1975 and doubled again to 8 billion in 2022. But rapid population growth is coming to an end, as discussed in a March 6 On the Economy blog post by economist Mark L.J. Wright and research associate Amy Smaldone. They noted that the world’s population is expected to peak around 10.5 billion later this century and then start to decline, as the chart below shows.
The authors discussed declining fertility rates and increased lifespans, which together have resulted in a rapidly aging population.
World Population
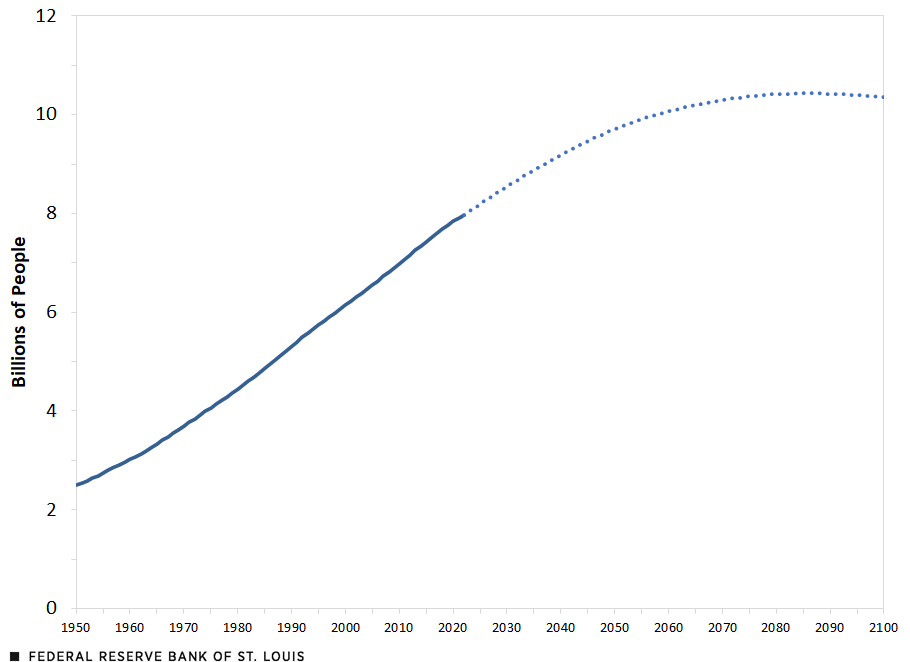
SOURCE: U.N. World Population Prospects, 2022.
NOTE: The dotted line indicates the data are projected numbers.
Kristie Engemann, a senior coordinator in the External Engagement and Corporate Communications Division, compiled this blog post.
This blog explains everyday economics and the Fed, while also spotlighting St. Louis Fed people and programs. Views expressed are not necessarily those of the St. Louis Fed or Federal Reserve System.
Email Us