


What Is the Probability of a Recession? The Message from Yield Spreads
Congress has given the Federal Open Market Committee (FOMC) a dual mandate: to maintain stable prices and maximum sustainable employment.Technically, the mandate also includes “moderate long-term interest rates,” but it is generally thought that such moderation in interest rates would be the natural outgrowth of achieving price stability. The mandate to maintain stable prices is generally thought to imply low and stable inflation, which the FOMC has specifically interpreted as a 2% annual change in the personal consumption expenditure (PCE) price index. After a recent burst of inflation to a peak of almost 7% in June 2022, PCE inflation has been declining back toward the FOMC’s 2% inflation target, while expected inflation—implied by bond prices and surveys—has remained consistent with the FOMC’s target.
Starting in March 2022, the FOMC responded to this burst of inflation by hiking the federal funds target range from 0%-0.25% to its current level of 5.25%-5.50%. Although inflation has declined and that decline will probably continue, it is uncertain what the shift from accommodative to this moderately restrictive monetary policy will do to real economic activity. To assess the likelihood of recession in the next year or so, this blog post explains and reviews recession forecasts from the yield curve, i.e., nominal and real term spreads.
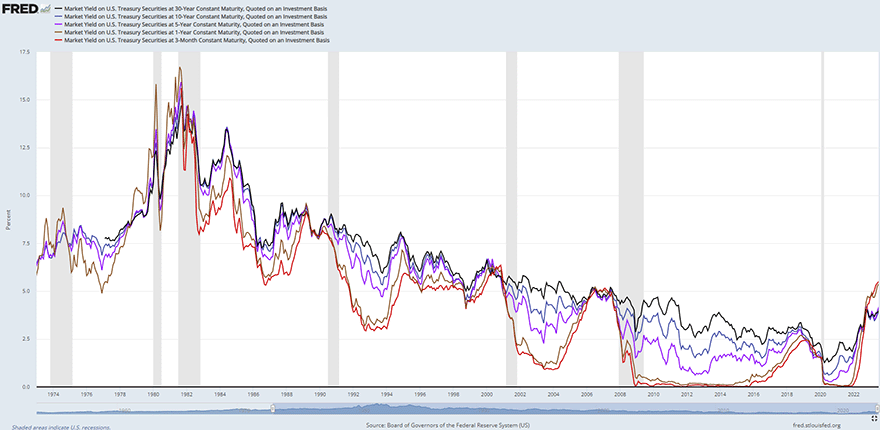
A yield curve is just a picture of interest rates or yields on bank deposits and bonds with similar risk characteristics at a point in time. That is, a yield curve describes how short, medium, and long rates relate to each other at a single time. The figure below shows that short rates are usually lower than long rates. In other words, one-year yields are usually lower than five-year yields, which are usually lower than 10-year yields. That is, the yield curve usually slopes upward if you graph these yields by maturity. When short rates are about equal to long rates, that is called a flat yield curve. An inverted yield curve is one in which short rates are higher than long yields. In other words, an inverted yield curve means that the yield curve is sloping down instead of up.
Yield Curve Inversion as a Predictor of Recessions
Since late 2022, several prominent measures of the yield spread—the short rates less long rates—have been very low or negative. That is, short rates are now higher than long rates and they have been for most of the past year. This is concerning because past yield curve inversions have reliably predicted recessions, that is, sustained downturns in economic activity, as defined by the National Bureau of Economic Research (NBER). There is nothing special about a yield curve that happens to be slightly downward sloping as opposed to flat. Both predict reduced economic activity in the future.
There are multiple stories about why an inverted yield curve predicts recession. Two of the most common are the following:
- Fed tightening raises short-term interest rates, and this action makes it more expensive to borrow for investment and consumption and thereby slows the economy.
- Low medium- and long-term interest rates indicate relatively low desired investment and lower growth in the future.
There are many measures of the slope of the yield curve, and economists and forecasters have different views as to the best one to use. Eric Engstrom and Steven Sharpe, for example, argue for the use of the near-term forward spread, which is the difference in the 18-month and three-month interest rate.See Engstrom, Eric C.; and Sharpe, Steven A. “The Near-Term Forward Yield Spread as a Leading Indicator: A Less Distorted Mirror.” Financial Analysts Journal, 2019, Vol. 75, No. 4. DOI: 10.1080/0015198X.2019.1625617. The authors argue that this spread is more closely related to near-term monetary policy expectations.
Nominal vs. Real Yield Spreads
There is a longer history, however, of using spreads between long-term and short-term interest rates. I follow the practice from a regular forecast produced by the Federal Reserve Bank of New York, which uses the spread between the 10-year and three-month Treasury rates.The Federal Reserve Bank of New York succinctly explains the procedures for the recession prediction. For a deeper dive, see Arturo Estrella and Gikas A. Hardouvelis’s 1991 article, Arturo Estrella and Frederic S. Mishkin’s 1996 article, and Arturo Estrella and Mary R. Trubin’s 2006 article. The next figure shows two interesting features of the 10-year-three-month term spread.
10-Year-Three-Month Yield Spread in Nominal and Real Terms
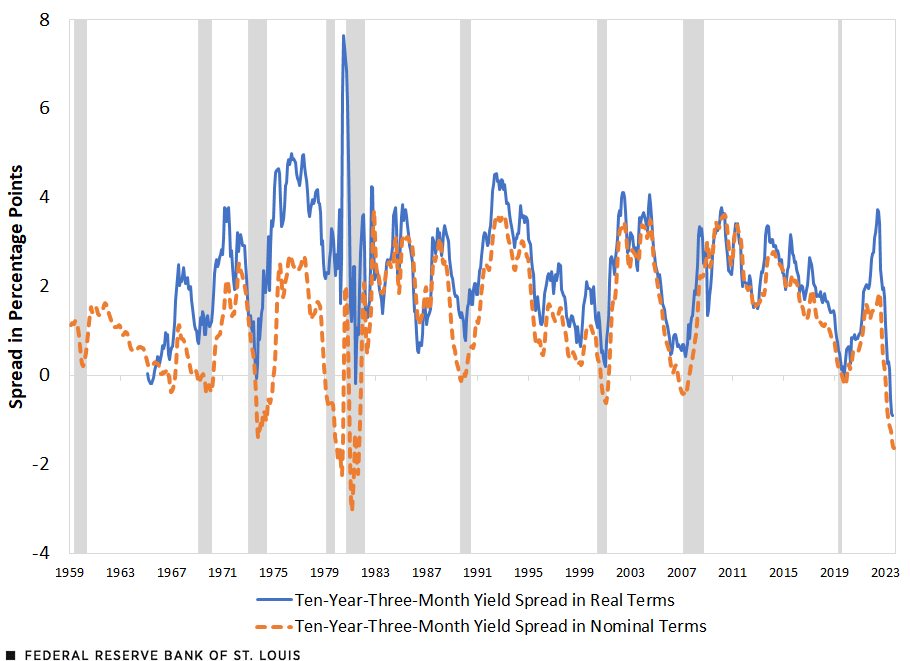
SOURCES: FRED (Federal Reserve Economic Data), Federal Reserve Bank of New York, Survey of Professional Forecasters, Livingston Survey and author’s calculations.
NOTE: Shaded areas depict NBER recessions.
First, like other term spreads, it is usually positive. That is, long-term rates are almost always higher than short-term rates. Second, when the 10-year-three-month spread declines, a recession becomes statistically more likely. A negative spread—i.e., an inverted yield curve—has preceded each recession since the 1950s. The model is not perfect, however; there were false positives—that is, high probabilities of recession when no recession occurred—in the late 1960s and late 1990s.
A statistical model called a “probit” translates the level of the spread into a formal probability of recession. The spread does predict recessions well, in the sense that implied recession probabilities rise before each recession. The next figure illustrates the time series of estimated 12-month ahead recession probabilities from the nominal and real 10-year-three-month term spreads.
12-Month Ahead Recession Probabilities Derived from Yield Spreads
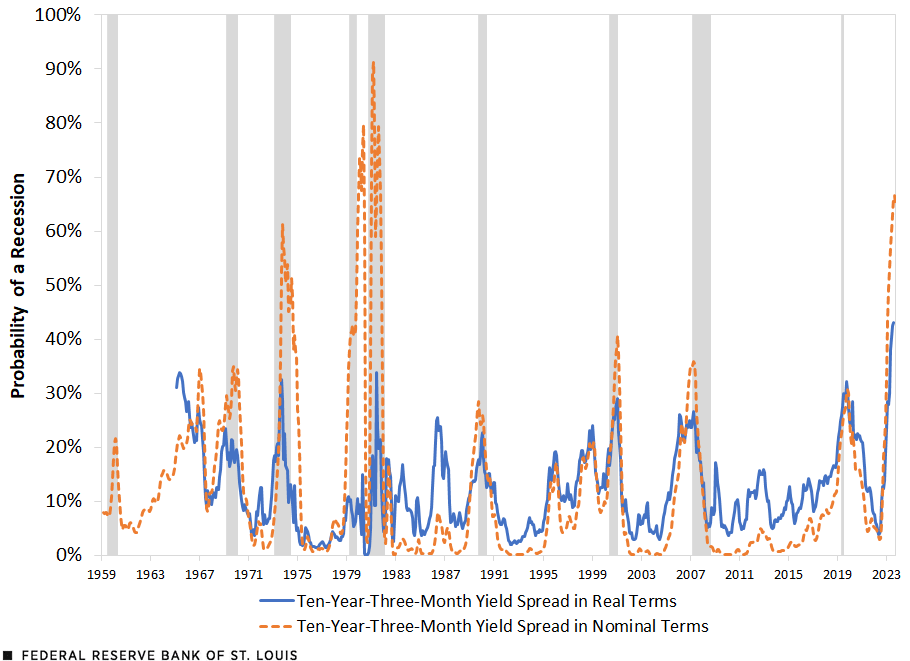
SOURCES: FRED (Federal Reserve Economic Data), Federal Reserve Bank of New York, Survey of Professional Forecasters, Livingston Survey and author’s calculations.
NOTE: Shaded areas depict NBER recessions.
The nominal yield spread is currently negative—quite low by historical standards—and predicts a 65% probability of recession in 12 months.The recession forecasts quoted here can vary modestly for a number of reasons, including different estimation samples or use of different final data on which to condition current forecasts. For example, at the time of this writing, the New York Fed’s website reports a 66% probability of recession based on the nominal 10-year-three-month yield spread using July 2023 data as the latest predictive information, with the model’s parameters estimated using data from January 1959 to December 2009. This recession probability would be unprecedentedly high for a false positive. The near-term forward spread from the Board of Governors currently implies a 50% chance of recession 12 months from now.The near-term forward spread is the difference between the forward rate on a three-month Treasury bill six quarters in the future and the yield on a three-month Treasury bill.
The Value of Examining Real Spreads
There are good arguments, however, for looking at real—that is, inflation adjusted—spread measures, rather than nominal measures. Because borrowers, lenders, consumers, and investors make decisions based on inflation-adjusted interest rates, real interest rates should be more closely related than nominal interest rates to both the stance of monetary policy and expected future economic growth. For example, a nominal federal funds rate of 5% is a very restrictive rate if expected inflation is 1%, but very accommodative if expected inflation is 10%. Recently, however, 10-year and one-year inflation expectations differed more than usual, meaning that the current 10-year-three-month nominal spread could be less informative than it has been in the past.Inflation expectations can be estimated in several ways. The most common are “break-even” expected inflation from real and nominal bonds and survey measures. Some surveys are of the general public; other surveys are of specialized groups, such as economic forecasters.
To measure the impact of a similar “real” spread, I correct the 10-year-three-month spread for expected inflation using forward-looking 10-year inflation expectations from the Survey of Professional Forecasters and one-year inflation expectations from the Livingston Survey. I use one-year expected inflation to deflate the three-month yield, rather than shorter horizon expectations, such as a six-month yield, because one-year expectations are slightly more stable than six-month data (and both are very highly correlated).
The third figure shows implied probabilities of recession over time using probit models of real and nominal spreads. The “real” interest rate spread implies a still elevated, but lower probability of recession in 12 months, of about 40%.I have used survey data on 10-year inflation expectations from the Survey of Professional Forecasters and data from the Livingston Survey on one-year inflation expectations. This 40% probability is the highest probability in the history of the series, exceeding that even in any actual recession.
One interpretation of this discrepancy between the implied probabilities from nominal and real yield spreads is that the probability of recession in 12 months is somewhat lower than usually claimed. Unfortunately, the real spread does not fit the recession data as well as the nominal spread by conventional statistical measures. It isn’t obvious why it should not. This poorer fit might reduce the confidence in the forecast from the real spread.
The difference between the nominal and real yield spreads is equal to the difference between 10-year and one-year expected inflation. So, this difference in expected inflation over long-short horizons must drive the difference in how the spread data predict recessions.
The figure below shows that the difference between the one-year and 10-year expected inflation has usually been pretty small, less than one percentage point, since the early 1960s. But this difference did increase significantly in about 1975—during the first oil shock and coincident inflation—and in about 1981—during the great disinflation.
During these two periods, which each coincided with recessions, 10-year expected inflation was much lower than one-year expected inflation, and the real 10-year-three-month spread rose relative to the nominal version, which made the real spread a weaker predictor of those recessions. In other words, the nominal spread predicted the 1975 and 1981 recessions better than the real spread. The reason for this disparity is not clear and it could just be “bad luck.”
This difference in historical data means that the real spread’s predictions are not as sensitive to fluctuations in the real spread. That is, the model implied by the real spread just doesn’t predict as well as that of the nominal spread.
10-Year Minus One-Year Expected Inflation
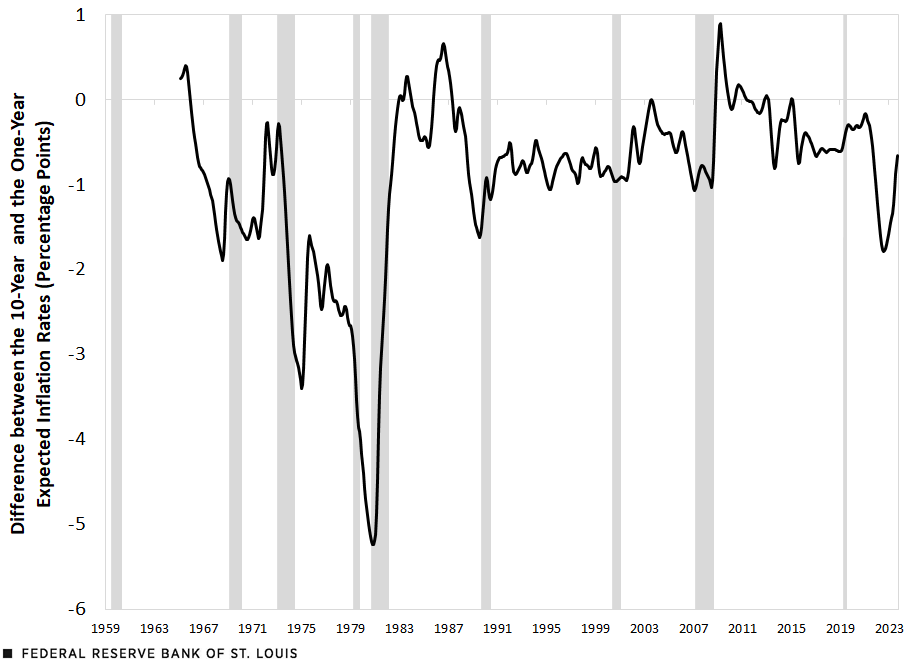
SOURCES: Survey of Professional Forecasters, Livingston Survey and author’s calculations.
NOTE: Shaded areas depict NBER recessions.
One should take recession forecasts with a grain of salt and look at a variety of indicators, because even if a model were literally correct instead of an approximation, these models predict 40%, 50%, 60% probabilities of recessions, which means there is a fair likelihood of a soft landing. In addition, one should remember that forecasting relations can and do break down. Past success doesn’t guarantee future results. Information from other sources can give us greater confidence in, or suggest skepticism about, the yield curve forecasts.
In summary, the inverted yield curve is consistent with the claim that currently monetary policy is moderately restrictive and that there is a relatively high probability of recession in the next 12 months. But no forecast is certain.
More on the Yield Curve
Listen to this Sept. 5 podcast with Christopher Neely as he discusses the significance of the inverted yield curve.

On the left, Christopher Neely, economist and senior economic policy advisor, at the St. Louis Fed.
A transcript is available at the Timely Topics podcast’s webpage.
This post was updated Oct. 6 to add the author’s interview on Timely Topics podcast series.
Notes
- Technically, the mandate also includes “moderate long-term interest rates,” but it is generally thought that such moderation in interest rates would be the natural outgrowth of achieving price stability.
- See Engstrom, Eric C.; and Sharpe, Steven A. “The Near-Term Forward Yield Spread as a Leading Indicator: A Less Distorted Mirror.” Financial Analysts Journal, 2019, Vol. 75, No. 4. DOI: 10.1080/0015198X.2019.1625617.
- The Federal Reserve Bank of New York succinctly explains the procedures for the recession prediction. For a deeper dive, see Arturo Estrella and Gikas A. Hardouvelis’s 1991 article, Arturo Estrella and Frederic S. Mishkin’s 1996 article, and Arturo Estrella and Mary R. Trubin’s 2006 article.
- The recession forecasts quoted here can vary modestly for a number of reasons, including different estimation samples or use of different final data on which to condition current forecasts. For example, at the time of this writing, the New York Fed’s website reports a 66% probability of recession based on the nominal 10-year-three-month yield spread using July 2023 data as the latest predictive information, with the model’s parameters estimated using data from January 1959 to December 2009.
- The near-term forward spread is the difference between the forward rate on a three-month Treasury bill six quarters in the future and the yield on a three-month Treasury bill.
- Inflation expectations can be estimated in several ways. The most common are “break-even” expected inflation from real and nominal bonds and survey measures. Some surveys are of the general public; other surveys are of specialized groups, such as economic forecasters.
- I have used survey data on 10-year inflation expectations from the Survey of Professional Forecasters and data from the Livingston Survey on one-year inflation expectations.

Citation
Christopher J. Neely, ldquoWhat Is the Probability of a Recession? The Message from Yield Spreads,rdquo St. Louis Fed On the Economy, Sept. 7, 2023.
This blog offers commentary, analysis and data from our economists and experts. Views expressed are not necessarily those of the St. Louis Fed or Federal Reserve System.
Email Us
All other blog-related questions