


A Hard or Soft Landing? The Answer May Lie in the Beveridge Curve
As the Federal Reserve continues its efforts to curb high inflation, there has been debate among economists over the past year on whether the U.S. is headed for a recession. In July 2022, Andrew Figura and Federal Reserve Gov. Chris Waller posited that the Fed can continue bringing down inflation without causing unemployment to rise so much that it significantly slows down economic activity. Olivier Blanchard, Alex Domash and Lawrence Summers, on the other hand, argued that a significant increase in unemployment is necessary for taming inflation; in their view, a soft landing was highly unlikely.
Both analyses looked at the Beveridge curve, which captures the negative relationship between the vacancy or job openings rate and the unemployment rate. The figure below plots a standard Beveridge curve using vacancies data from the Job Openings and Labor Turnover Survey (JOLTS), as well as unemployment and labor force levels from the Current Employment Statistics report, both published by the Bureau of Labor Statistics (BLS). Our sample goes from December 2000 to April 2023.
Specifically, we plotted the unemployment rate (the unemployment level divided by the labor force) on the x-axis, against the vacancy rate (the number of vacancies divided by the labor force), on the y-axis. It is instructive to first consider the downward slope of the Beveridge curve: As labor demand falls, evidenced by the declining number of job openings, unemployment increases.
Standard Beveridge Curve
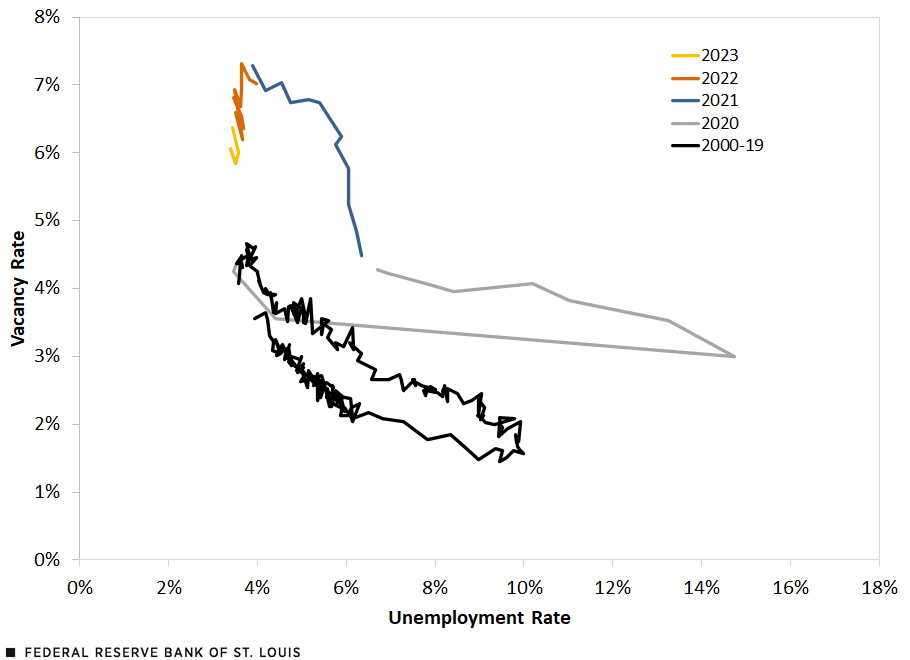
SOURCES: Bureau of Labor Statistics and authors’ calculations.
The flatter the slope, the greater the rise in the unemployment rate relative to a decline in the vacancy rate. The standard Beveridge curve, as it is rather flat, seems to support the Summers argument: A meaningful decrease in the vacancy rate cannot occur without a substantial increase in the unemployment rate. A “hard landing” scenario seems likely by just looking at the standard curve.
Adjusting the Curve for Employer-to-Employer Transitions
An important caveat is that mass reallocation characterizes the labor market recovery from COVID-19. During what was often dubbed “the Great Resignation” in the media, workers across different occupations were primarily quitting to switch to a new job, rather than quitting into unemployment, as our On the Economy blog post from June 2022 pointed out. It would be remiss then not to account for employer-to-employer (EE) transitions when constructing the Beveridge curve, as unemployed individuals are competing not only with their unemployed peers for each vacancy but also with employed workers who would like to change their jobs.
The figure below plots the unemployment level plus the number of realized EE transitions among employed workers divided by the labor force, against the vacancy rate. We obtained our estimates of the EE rate, or the average probability of transitioning to a new employer in the next month for U.S. workers, from a data set created by Shigeru Fujita, Giuseppe Moscarini and Fabien Postel-Vinay (PDF) in a 2023 paper.
The number of realized EE transitions is calculated as the employment level times the transitioning probability. The result is already slightly steeper Beveridge curves for the periods starting in January 2021, in which a similar increase in the fraction of the number of unemployed individuals and the realized number of EE switches in the labor force is associated with a slightly larger decrease in the vacancy rate.
Beveridge Curve Adjusted for Realized Employer-to-Employer Job Switches
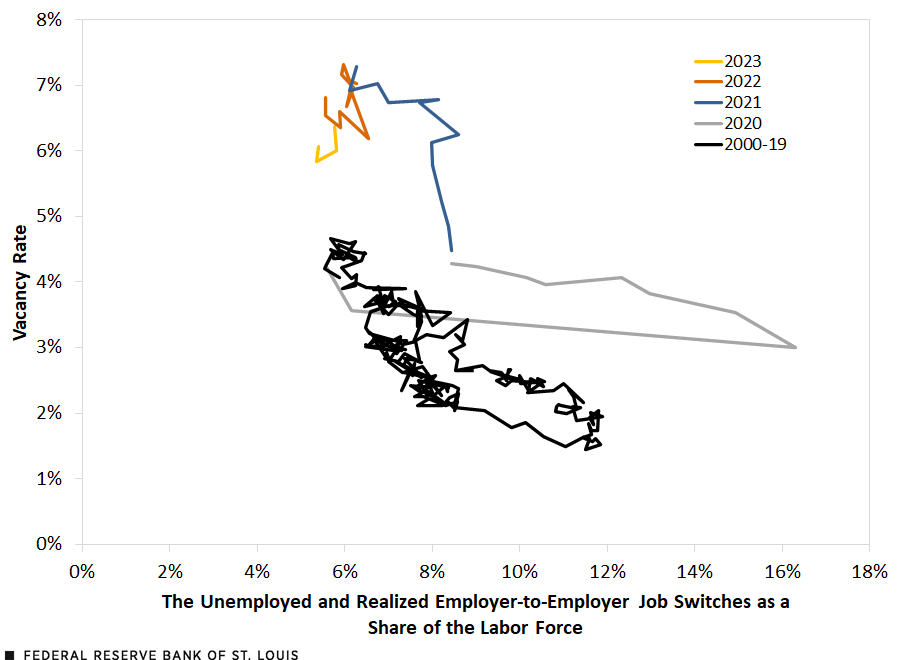
SOURCES: Bureau of Labor Statistics; Fujita, Moscarini and Postel-Vinay, 2023; and authors’ calculations.
Not all workers who are employed and searching for a new job end up in one, however. To account for all searching workers—not just those who end up switching, as shown in the second figure—we assume that about 22% of employed workers in any given month are searching for new employment. This assumption is motivated by the empirical findings of R. Jason Faberman, Andreas I. Mueller, Ayşegül Şahin and Giorgio Topa (2022), who used data from the New York Fed’s Survey of Consumer Expectations and documented that around 22% of employed workers search for a new job.
The figure below plots the unemployment level plus the number of searching employed workers divided by the labor force, against the vacancy rate. The result is starkly steep Beveridge curves during the periods starting in 2021: A sizable drop in the vacancy rate only leads to a small increase in the fraction of job seekers in the labor force. For 2022 and the first four months of 2023, the curves are nearly inelastic.
Beveridge Curve Adjusted for Employed Job Seekers
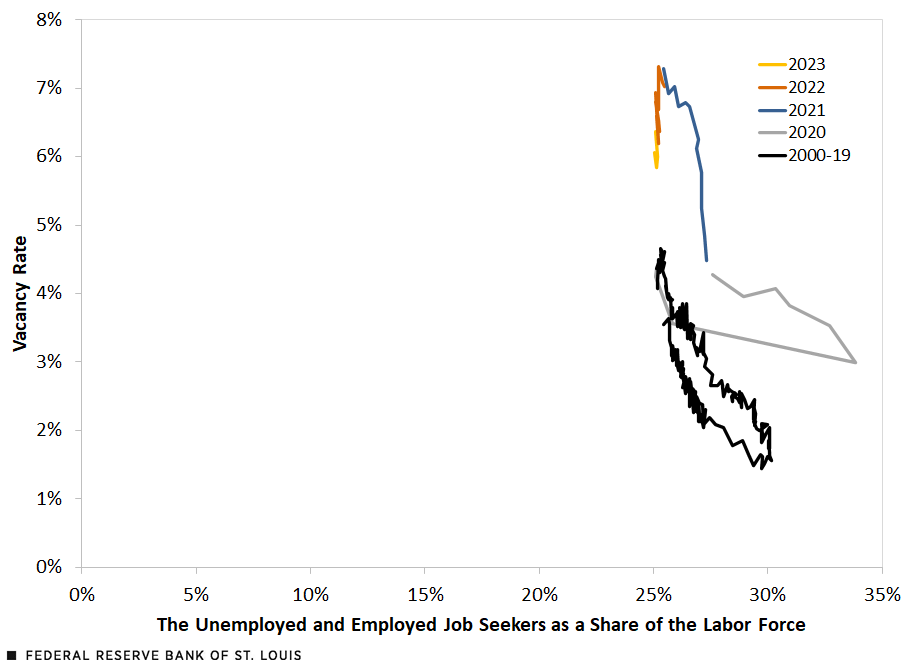
SOURCES: Bureau of Labor Statistics; Faberman, Mueller, Şahin and Topa, 2022; and authors’ calculations.
Differences between the Unemployed and the Employed
Unemployed and employed individuals may not exert the same effort to find a job. We further assume that those employed only spend half as much time on job searching as those unemployed, and divide the number of employed searchers used in the third figure by two.
This assumption is also motivated by the empirical findings of Faberman, Mueller, Şahin and Topa, who show that the average number of job applications among employed job seekers is around half of that for the unemployed and that the former group spends around half as much time searching for a job as the latter.
The figure below plots the unemployment level plus the number of searching employed workers adjusted by their time input into the job search divided by the labor force, against the vacancy rate. Again, we see steep Beveridge curves during the pandemic, lending support to Figura and Waller’s argument. Here, a soft landing is possible, as a meaningful decrease in the vacancy rate will not cause the fraction of job seekers in the labor force to significantly rise.
Beveridge Curve Adjusted for Employed Job Seekers and Time Input
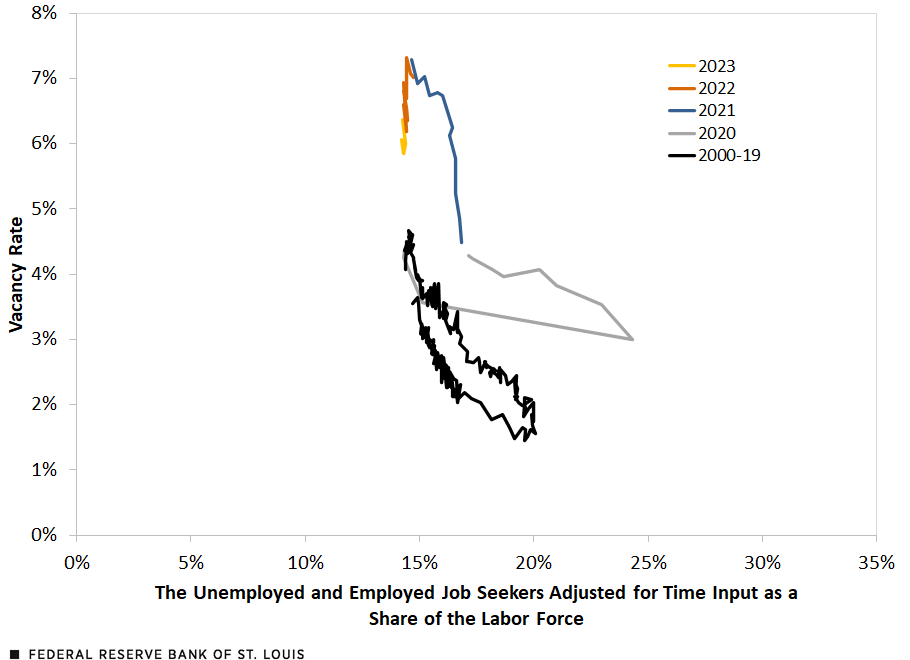
SOURCES: Bureau of Labor Statistics; Faberman, Mueller, Şahin and Topa, 2022; and authors’ calculations.
Reallocation Appears to Make the Beveridge Curve Steeper
Whether the Fed can curb inflation without bringing on a recession highly depends on labor market dynamics. In this blog post, we take a close look at the dynamics between vacancies and unemployment by examining the standard Beveridge curve and Beveridge curves adjusted for realized employer-to-employer transitions, employed searchers, and the time they put into job searching. Once we have taken into account reallocation—a defining characteristic of the pandemic labor market—the Beveridge curve is steep, suggesting the possibility of a soft landing.


Citation
Serdar Birinci and Trần Khánh Ngân , ldquoA Hard or Soft Landing? The Answer May Lie in the Beveridge Curve,rdquo St. Louis Fed On the Economy, July 13, 2023.
This blog offers commentary, analysis and data from our economists and experts. Views expressed are not necessarily those of the St. Louis Fed or Federal Reserve System.
Email Us
All other blog-related questions