The End of Rapid Population Growth
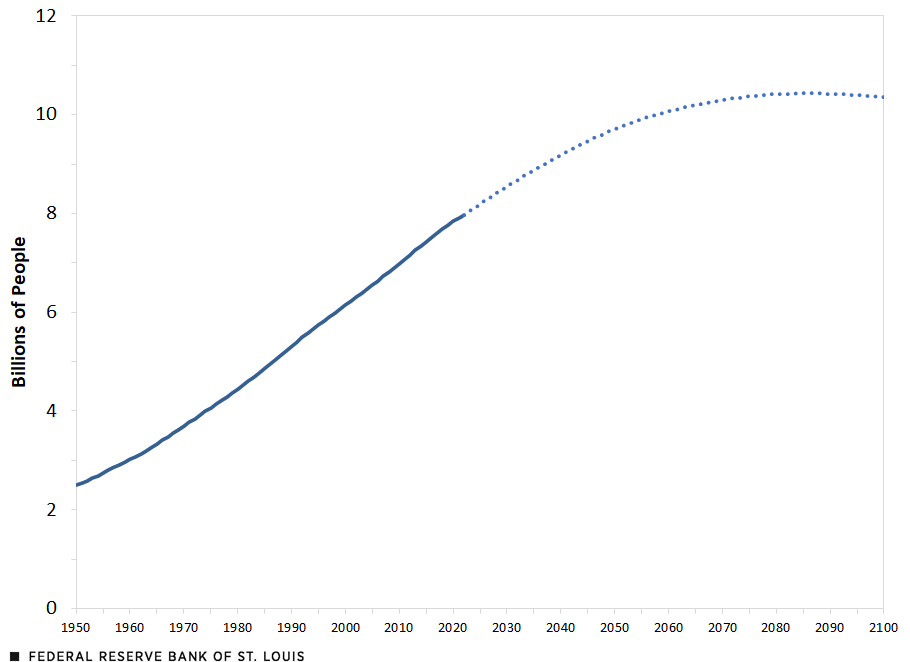
The world’s population recently reached 8 billion people—the culmination of a century of rapid population growth. Whereas it took 125 years for the world’s population to double from 1 billion (in 1803) to 2 billion (in 1928), it took only 47 years to reach 4 billion in 1975, and another 47 years to reach 8 billion last year.
However, the era of rapid population growth is coming to an end. As shown in the figure below, the United Nations projects that the world’s population will peak at around 10.5 billion people later this century before beginning to decline.
World Population
SOURCE: U.N. World Population Prospects, 2022.
NOTE: The dotted line indicates the data are projected numbers.
The Geography of Population Growth
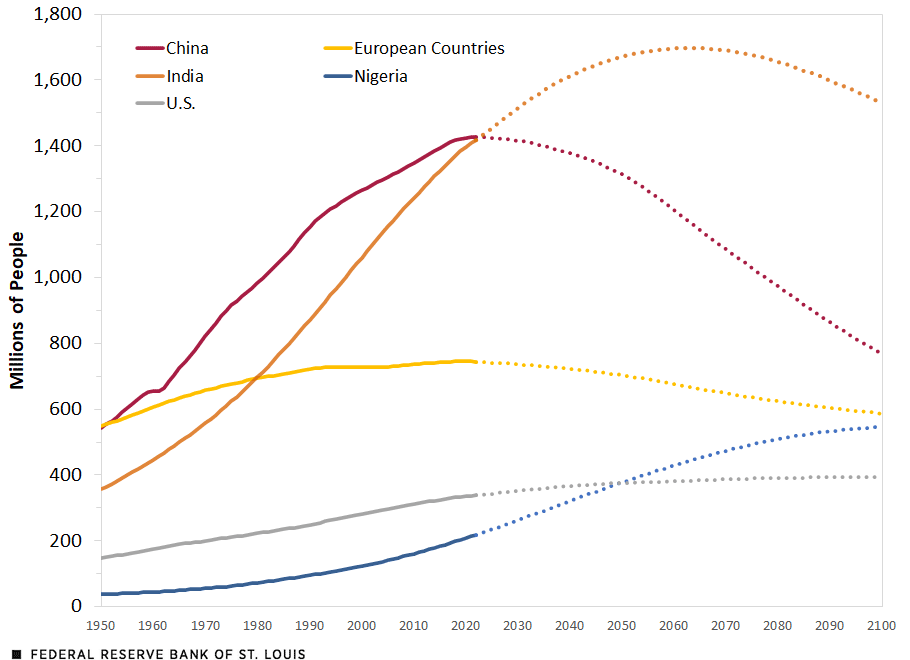
As shown in the next figure below, India will surpass China this year as the world’s most populous nation, with 1.4 billion inhabitants, before peaking at about 1.7 billion in 2063. China’s population is expected to rapidly decline, ending the century around 800 million. Europe’s population has plateaued at approximately three-quarters of a billion people and will decline below 600 million by the end of the century, while the U.S. population is expected to level off at around 400 million.
What little growth in population the world sees in the second half of the century will be driven by Africa, which projects to rise to 38% of the world’s population from 18% today. Nigeria’s population will top 500 million by the end of the century.
Population Trends of Select Countries
SOURCE: U.N. World Population Prospects, 2022.
NOTES: The dotted lines indicate the data are projected numbers. We follow the U.N. Statistical Division’s definition of European countries.
Understanding the Dynamics of Falling Population Growth
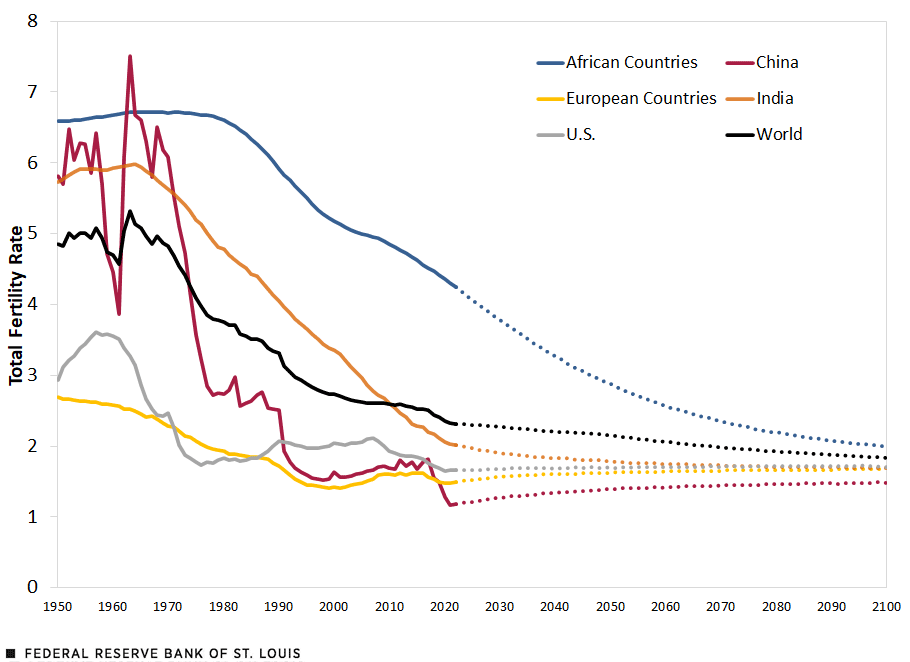
The slowdown in population growth is due to a collapse in childbirth around the world. As shown in the figure below, the total fertility rate (TFR)—which represents the expected number of births over a woman’s life derived by extrapolating birth rates by age in a given year—for the world as a whole has fallen from about 5 in 1950 to around 2.3 today. Current TFRs are well below the “replacement rate” (or level needed to keep the population constant) of 2.1 in European countries (where they average 1.5), as well as in China (1.2), South Korea (0.9) and Japan (1.3), and have fallen to 2.0 in India. In the U.S., the TFR sits at 1.7, which would imply negative population growth except that immigration levels are high.
Fertility Rates Continue to Fall Globally
SOURCE: U.N. World Population Prospects, 2022.
NOTES: The dotted lines indicate the data are projected numbers. We follow the U.N. Statistical Division’s definition of European countries.
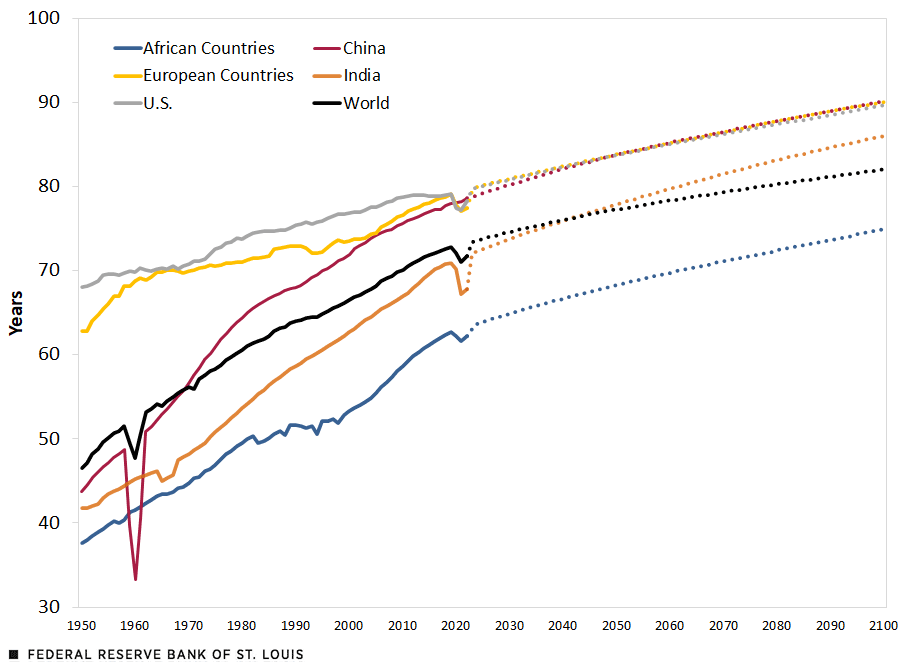
The decline in childbirth has been so dramatic that population growth would have collapsed long ago but for the fact that people are living much longer lives. As shown in the figure below, life expectancy at birth—which measures the expected lifespan of a newborn, extrapolating current-year mortality rates over a lifespan—on average around the world has risen from about 46 years in 1950 to almost 72 years today. This growth has been especially dramatic in Africa, where it grew from about 37 in 1950 to 62 today, even though it lags the levels achieved in the U.S. and Europe, where life expectancy approaches 80 today.
Life Expectancy at Birth Continues to Rise Globally
SOURCE: U.N. World Population Prospects, 2022.
NOTES: The dotted lines indicate the data are projected numbers. We follow the U.N. Statistical Division’s definition of European countries.
Declining fertility and increased lifespans have resulted in a rapidly aging population. The figure below plots the median age of the population—the age at which half of the people are younger and half are older—around the world. As recently as 1973, half of the world’s inhabitants were under age 21. By the end of the 21st century, more than half will be middle-aged or elderly (40 or older). Already today, about half of all residents of the U.S. and China are older than 37, while about half of all Europeans are older than 42. By the end of the century, more than half of China’s population will be 55 or older, and about half of all Europeans will be older than 50.
World’s Population Grows Older
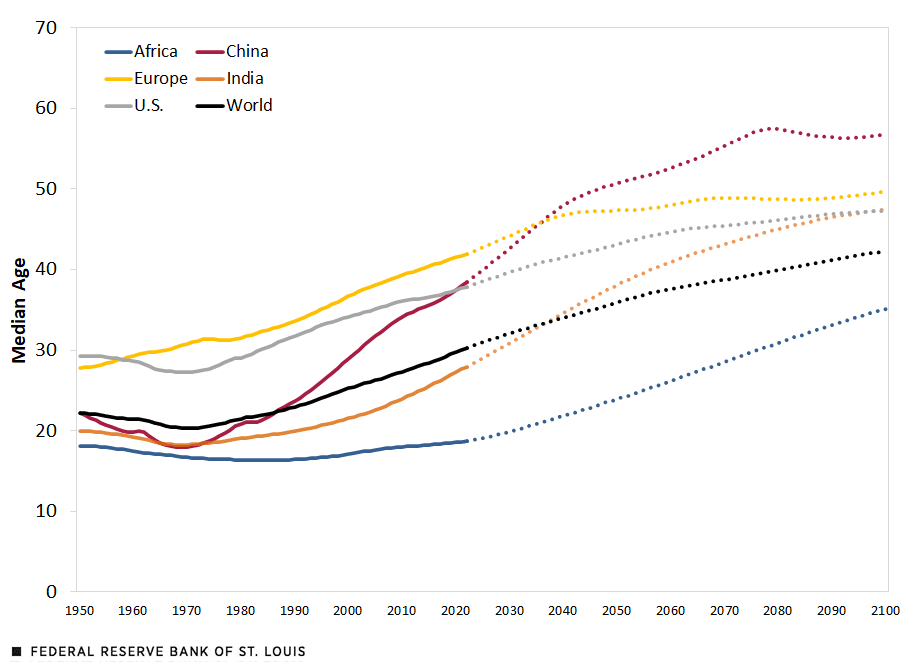
SOURCE: U.N. World Population Prospects, 2022.
NOTES: The dotted lines indicate the data are projected numbers. We follow the U.N. Statistical Division’s definition of Europe.
World Faces Declining Share of Young Workers
Those readers old enough may remember Yogi Berra’s famous dictum: “It’s tough to make predictions, especially about the future.” This certainly applies when predicting population growth for the next century. However, demographic trends move slowly and efforts to increase fertility in Europe and Asia have met with limited success so far, suggesting that these forecasts are plausible. And while individual rich countries may be able to offset declining fertility with increased immigration, the world as a whole will need to contend with a declining share of young workers.
It is likely that pension and health care benefits will come under pressure with a shrinking tax base to pay for them. Support for raising the retirement age will probably grow. Increasing numbers of younger people will need to care for the elderly unless these services can be automated, while automation may result in significant declines in service quality. And with fewer young people to innovate and become entrepreneurs, the pace of technological change may slow. Although the details are hard to predict, one thing seems certain: In the face of these profound changes in demographics, the changes in our way of life are likely to be profound, too.
Citation
Amy Smaldone and Mark L.J. Wright, ldquoThe End of Rapid Population Growth,rdquo St. Louis Fed On the Economy, March 6, 2023.
This blog offers commentary, analysis and data from our economists and experts. Views expressed are not necessarily those of the St. Louis Fed or Federal Reserve System.
Email Us
All other blog-related questions


