


Real Wage Growth at the Individual Level in 2022
With consumer price index (CPI) inflation reaching almost 9% and average nominal wage growth soaring to 6.4% during 2022, many households experienced both rising wages and a rising cost of living, which was documented in “Nominal Wage Growth at the Individual Level in 2022,” our first blog post in this two-part series. The difference between these two values determines real wage growth, which has been consistently positive over the last decade but dipped into negative values in early 2021 and throughout 2022.
In our previous post, we explored the first value that contributes to real wage growth—nominal wage growth—and found that, at the individual level, median nominal wage growth rates were positive across all income groups in 2022. In fact, lower-wage workers saw the highest median nominal wage growth rates. In this post, we address the second component of real wage growth rates: inflation. We then link individualized inflation rates to each individual’s nominal wage growth to obtain a measure of real wage growth at the micro level.
Measuring Nominal Wage Growth and Inflation at the Individual Level
To measure real wage growth on an individual level, we must have data on nominal wages as well as individual consumption. This, however, presents a challenge: There are no up-to-date microdata that combine information on both wage growth and consumption. To overcome this challenge, we imputed consumption data from the Consumer Expenditure Surveys (CEX) into the Current Population Survey (CPS), which has wage growth data. The CEX is published annually by the Bureau of Labor Statistics (BLS) and collects information on expenditures and demographic characteristics of consumers, while the CPS is a monthly survey conducted by the BLS that provides data on the labor force. The CPS first interviews individuals for four consecutive months and again 12 months later, allowing for the year-over-year wage change to be calculated for each respondent, as we documented in our previous post.
To create a consumption basket for each CPS respondent, we used the annual CEX published tables that provide information on annual average consumption for item categories across eight different demographic and geographic characteristics.These characteristics are income (PDF), household size (PDF), region (PDF), age (PDF), education (PDF), race (PDF), ethnicity (PDF) and metropolitan area type (PDF). Item expenditures for individuals in the CPS are then imputed by taking a weighted sum of the average consumption based on each individual’s demographic attributes. These imputed item expenditures are then used to calculate an individual’s inflation rate in 2022. We combine them with the corresponding item’s year-over-year CPI inflation rate to produce inflation rates for each individual in the CPS. Finally, real wage growth is found by taking the difference between the nominal wage growth rate and the inflation rate of the individual.
Real Wage Growth at the Individual Level
Individual inflation rates in 2022 have a much narrower distribution than do individual nominal wage growth rates, as seen in the first two figures below. Most of the inflation rates are within a range of 2 percentage points, between 7.5% and 9.5%. This is a stark contrast to the wide range of nominal wage growth rates. This also means that the spread of real wage growth rates will be driven by nominal wage growth rates, rather than inflation rates.
Distribution of Nominal Annual Wage Growth Rates, 2022
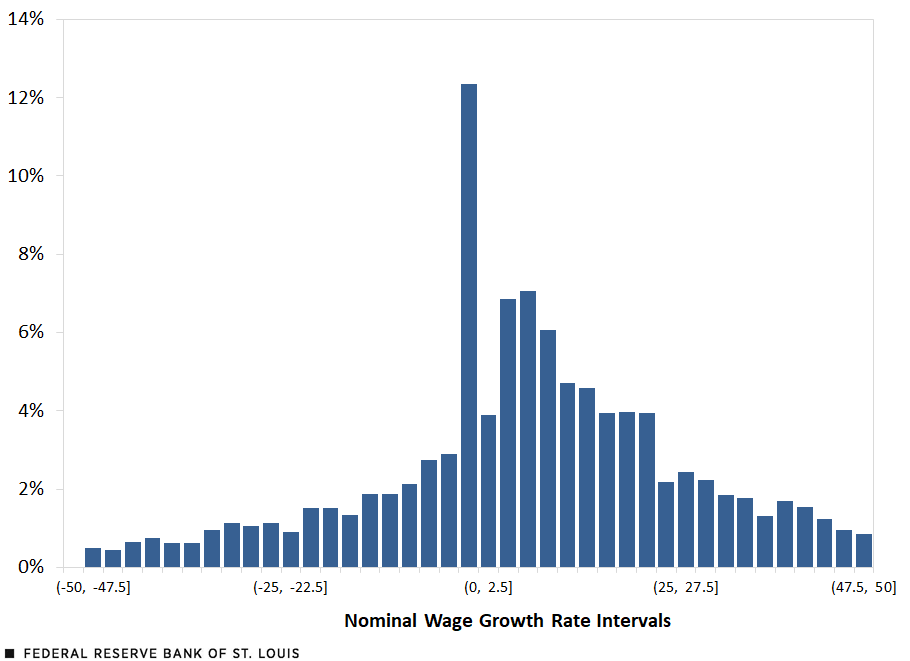
SOURCES: Authors’ calculations using Current Population Survey data from the Bureau of Labor Statistics.
Distribution of Annual Inflation Rates, 2022
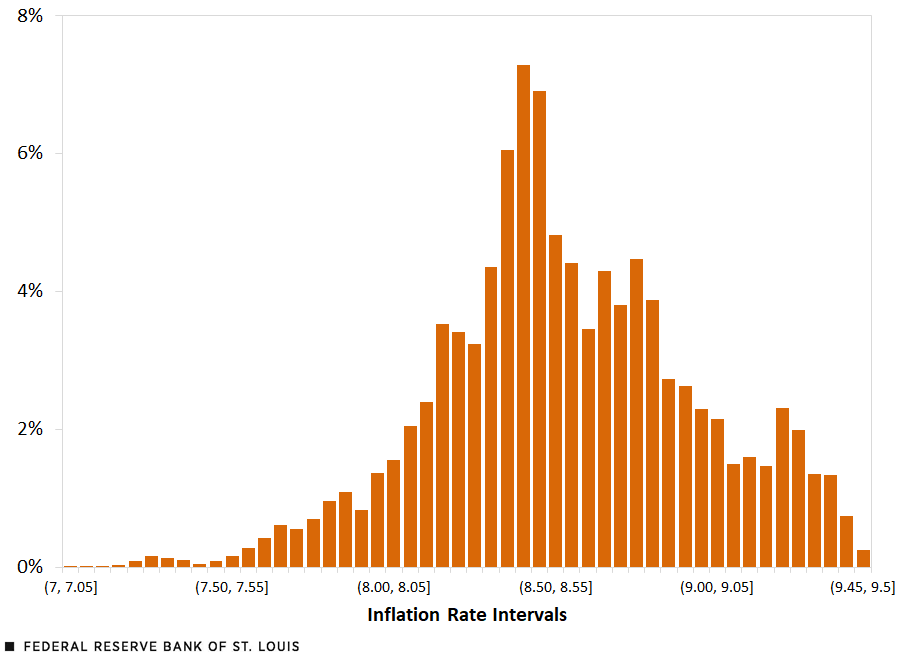
SOURCES: Authors’ calculations using Consumer Expenditure Surveys, Current Population Survey and consumer price index data from the Bureau of Labor Statistics.
We put together these two components to arrive at the distribution of real wage growth, shown in the next figure. Both the mean and median worker experienced negative real wage growth in 2022, meaning the growth of their wages did not keep up with the growth of prices in their consumption baskets. Altogether, this was the case for 54% of workers.
Distribution of Annual Real Wage Growth, 2022
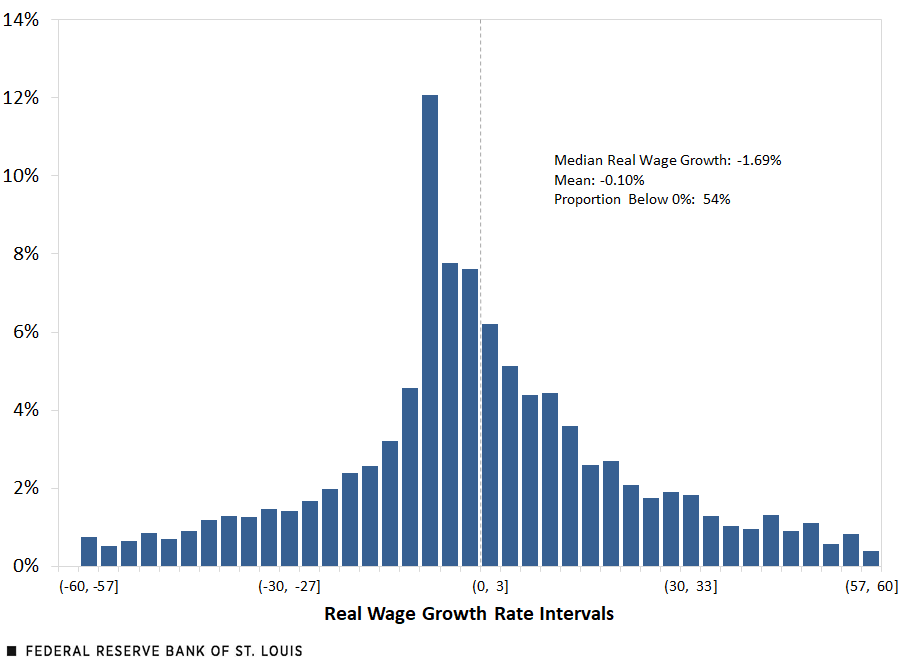
SOURCES: Authors’ calculations using Consumer Expenditure Surveys, Current Population Survey and consumer price index data from the Bureau of Labor Statistics.
The next figure plots real wage growth rates by income decile and depicts a picture similar to what we found for nominal wage growth by income decile. The lowest-wage workers (at the left side of the x-axis) tended to fare better than higher-wage workers in terms of real wage growth.
Real Wage Growth Rate by Wage Decile
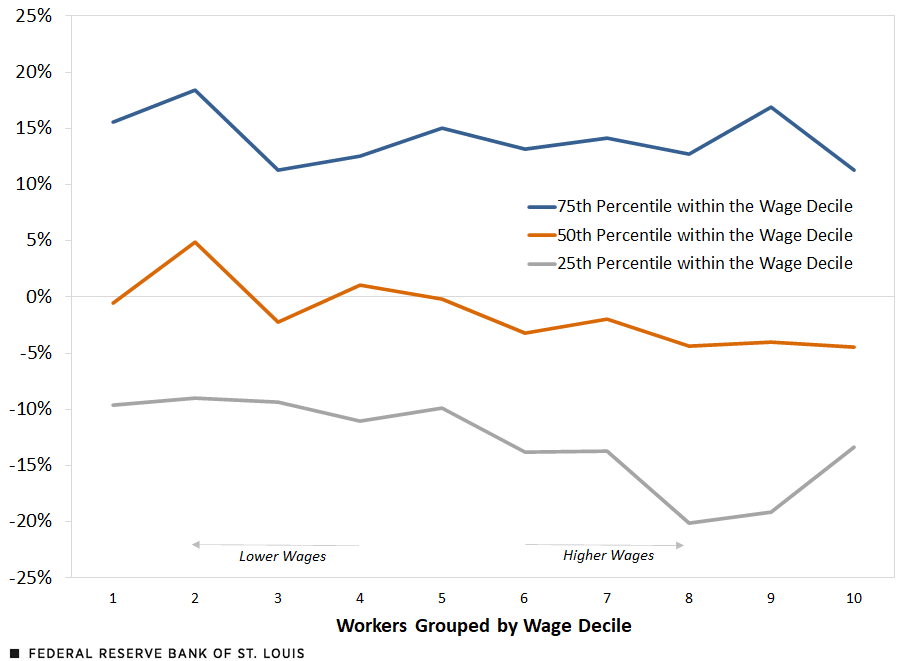
SOURCES: Authors’ calculations using Consumer Expenditure Surveys, Current Population Survey and consumer price index data from the Bureau of Labor Statistics.
NOTES: This figure was created by plotting the 25th percentile (lower), 50th percentile (median) and 75th percentile (higher) real wage growth rates at 10 wage deciles. The growth rates are the year-to-year percentage change between 2021 and 2022.
We next examined median real wage growth by demographic and job characteristics. For example, the next figure shows that workers younger than 25 years old experienced a positive real wage growth rate of 4.3%, while other age groups experienced negative real wage growth rates. In fact, the older the age group, the lower the real wage growth. Similarly, individuals with less than a high school diploma experienced smaller declines in their real wages than those in all other education groups. Finally, individuals who switched jobs saw smaller declines in their real wages—almost 2 percentage points less—than those who stayed in their jobs.
Real Wage Growth by Demographic and Job Characteristics, 2022
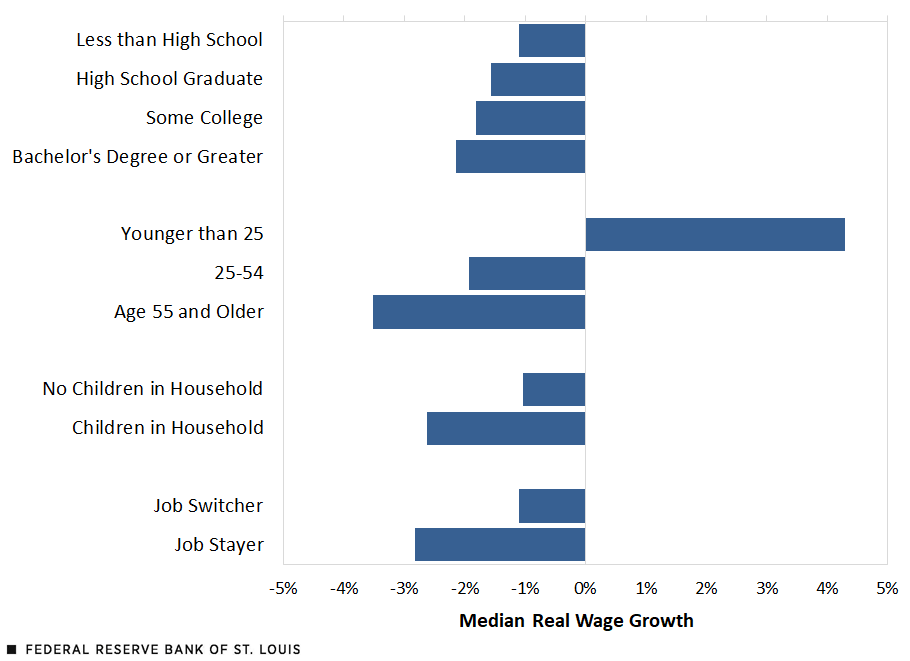
SOURCES: Authors’ calculations using Consumer Expenditure Surveys, Current Population Survey and consumer price index data from the Bureau of Labor Statistics.
Overall, for 54% of workers, nominal wage growth has not kept up with inflation. Typically, the share of workers with real wage declines ranged from 42% to 48% from the mid-1990s up to 2019, according to the Dallas Fed. Here, we took into account variation in consumption baskets and found that it does not play a large role in differences across individual real wage growth. However, young workers, low-income workers and job switchers tended to fare better this past year due to their higher-than-average nominal wage growth.
Note
- These characteristics are income (PDF), household size (PDF), region (PDF), age (PDF), education (PDF), race (PDF), ethnicity (PDF) and metropolitan area type (PDF).


Citation
Victoria Gregory and Elisabeth Harding, ldquoReal Wage Growth at the Individual Level in 2022,rdquo St. Louis Fed On the Economy, March 27, 2023.
This blog offers commentary, analysis and data from our economists and experts. Views expressed are not necessarily those of the St. Louis Fed or Federal Reserve System.
Email Us
All other blog-related questions