


Is Inflation on the Way Out or Here to Stay?
Since March 2021, inflation has been above the Federal Reserve’s 2% target. After peaking in June 2022, inflation—measured as the 12-month change in the personal consumption expenditures (PCE) price index—trended steadily downward for a year. This decline reversed in July and August 2023, though some other measures of inflation continued to fall. Regardless of how we measure it, inflation remains high.
Do these developments signal the end of high inflation is nigh, or will inflation instead settle at rates higher than in the period prior to the COVID-19 pandemic? In this blog post, I will provide relevant evidence to shed light on this debate, which is central to future monetary policy. In addition, the Bureau of Economic Analysis (BEA) recently published a comprehensive update to the national accounts, so this provides a good opportunity to take a renewed look at the data.This blog post is part of a series that started in April 2021 with “Is Inflation Making a Comeback?”; my most recent posts this year were the May 8 post "Understanding the Recent Behavior of Inflation" and the May 9 post "Where Might Inflation Head?"
The Overall Inflation Picture
Inflation is the change in the price level over a period of time. The Federal Reserve’s preferred measure for the price level is the PCE price index, as published by the BEA. The Federal Reserve also pays close attention to core PCE inflation, i.e., excluding the contribution of food and energy prices, which tend to be very volatile and largely determined by external factors. Core inflation is thus deemed more informative about underlying inflation trends. Note, however, that recent experience and some research have cast doubt on the appropriateness of excluding food.
The figure below shows inflation rates, measured as the 12-month change in the price index. It includes three measures: one that includes all consumption items (headline), one that excludes energy, and one that excludes both food and energy (core).
Annualized Inflation Rates

SOURCES: Bureau of Economic Analysis and Haver Analytics.
All three measures of inflation increased significantly since March 2021 and have remained well above 2% annual. Clearly, energy prices contributed to inflation dynamics, making the initial rise in inflation and its subsequent fall more pronounced. The recent increase in energy prices contributed to a reversal in the decline of headline inflation and will likely contribute upward pressure in the months to come. By comparing the series excluding energy and the core series, we can also see the contribution of food to overall inflation during 2022.
Focusing on core goods and services, inflation was below the Federal Reserve’s target in the years prior to the pandemic, averaging 1.7% annual between 2016 and 2019. It remained close to that average during the initial year of the pandemic and then jumped to 5.2% annual in 2021 and 4.9% annual in 2022. So far, the annualized inflation rate for core goods and services in 2023 is 3.6%, lower than in preceding years but still well above the target.
What Are the Key Components Driving Inflation?
The table below decomposes inflation into five major categories: food, energy, core goods, core services excluding housing, and housing. The contribution of these components in total consumption expenditures is, roughly, 8%, 4%, 22%, 50% and 16%, respectively. The table measures inflation rates over various periods of interest. The first, 2016-2019, represents the years immediately prior to the pandemic. Next are the years 2020, 2021, 2022 and, finally, 2023 up to August, the latest date available. All inflation rates are annualized to make them comparable across periods of different length.
| Food | Energy | Core Goods | Core Services Excluding Housing |
Housing | |
|---|---|---|---|---|---|
| 2016-2019 | 0.2% | 4.2% | -0.6% | 2.2% | 3.4% |
| 2020 | 3.9% | -7.5% | 0.1% | 2.1% | 2.2% |
| 2021 | 5.7% | 30.5% | 6.2% | 5.2% | 3.7% |
| 2022 | 11.1% | 6.9% | 3.1% | 4.8% | 7.7% |
| 2023 | 1.4% | 1.8% | 0.9% | 3.9% | 6.6% |
| SOURCES: Bureau of Economic Analysis, Haver Analytics and author’s calculations. | |||||
| NOTE: The 2023 period is the year through August. | |||||
The table shows that inflation varies significantly across these broad categories. Prior to the pandemic, food prices were stable, and core goods prices were declining, while core services excluding housing and housing were both growing above the Federal Reserve’s target rate. When combined, these numbers implied an overall inflation rate of 1.6% annually, which is below the target.
All categories contributed to the high overall inflation in 2021 and 2022. So far in 2023, inflation in food, energy and core goods has decelerated markedly, falling below 2% at annual rates. In contrast, inflation in core services excluding housing and in housing decelerated but remain well above 2% annual. Core services, which includes housing, represent two-thirds of consumption expenditures. Hence, inflation in this category will have to fall substantially more before overall inflation can be sustained close to target.
How Widespread Is Inflation?
We can further inspect the distribution of inflation across individual product categories. The disaggregated data published by the BEA consist of 244 product categories with monthly series on expenditures, prices and real quantities. For each product category, I computed the annualized price change and the expenditure share in each period. The figure below estimates the distribution of inflation for 2021, 2022 and 2023 (up to August) across product categories, with annualized price changes on the horizontal axis and the corresponding expenditure shares on the vertical axis.For a full description of the methodology, see my Oct. 19, 2021, blog post “How Widespread Are Price Increases in the U.S.?”
Estimated Distribution of Annualized PCE Inflation
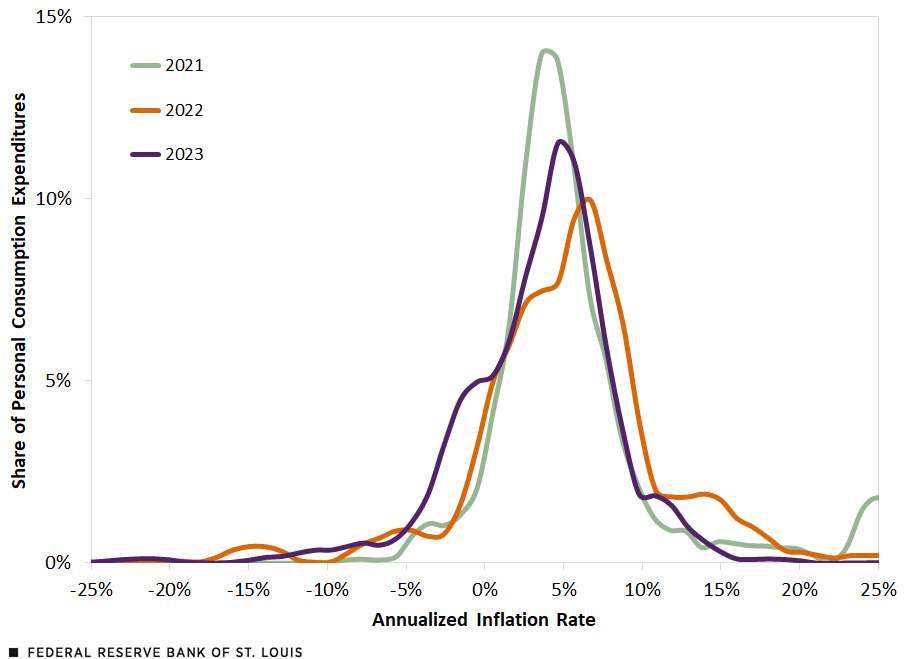
SOURCES: Bureau of Economic Analysis and author’s calculations.
NOTES: Distributions are computed with kernel density estimation in Stata, using the optimal bandwidth for each period. The 2023 period is the year through August.
So far, the distribution of inflation across product categories in 2023 seems to be somewhere in between the previous two years, but with important differences. Notably, the contribution of outliers to overall inflation is not as significant in 2023 as in previous years; that is, the share of expenditures in items experiencing high inflation rates is now much smaller. Furthermore, about one-fifth of consumption expenditures are in categories experiencing deflation, which contributes to the decline in overall inflation. Had the price of these products remained constant rather than declined, annualized inflation for 2023 through August would have been 0.8 percentage points higher.
The Effects of the Pandemic and Monetary Policy on Consumption
When the pandemic hit in 2020, the Federal Reserve lowered its policy rate to near zero, among other measures designed to support the economy. Beginning in March 2022, as high inflation endured, the Federal Reserve embarked on a series of rapid and sustained increases in the policy rate. As of August 2023, the federal funds rate and the yields on Treasuries at all maturities were above the inflation rate.
When interest rates rise, the demand for consumption is pressured downward, as higher rates make consumer financing more costly and increase the incentives to save. Lower demand then leads to lower inflationary pressures as producers and sellers find it more difficult to hike their prices. What was the response of consumption to the pandemic, inflation and monetary policy?
The figure below shows monthly consumption expenditures, measured in 2017 dollars, as well as their pre-pandemic trend.
Monthly Real Consumption
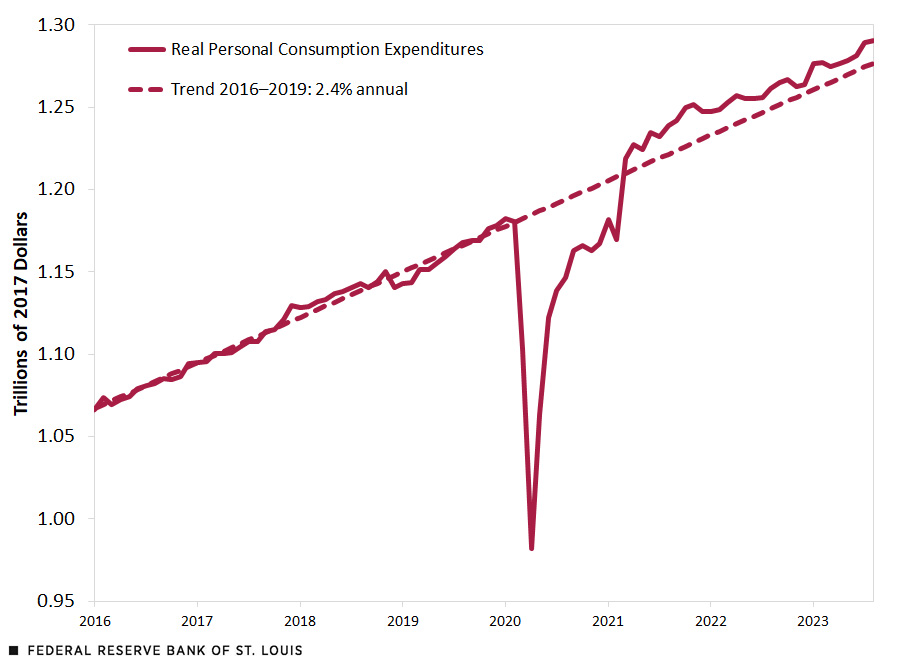
SOURCES: Bureau of Economic Analysis and author’s calculations.
Real consumption dropped significantly at the onset of the pandemic and took until March 2021 to return to its pre-pandemic trend. Since then, real consumption has remained persistently above trend, just like inflation and despite high interest rates. The boom in real consumption is mainly driven by expenditures on goods, as services have remained below trend though they have almost caught up.
If we take the difference between actual real consumption and its pre-pandemic trend, we get an accumulated consumption deficit of $375 billion (in 2017 prices) since the start of the pandemic. This deficit represents $455 billion in current prices or about a third of monthly consumption.
There are then two opposing forces operating on consumer demand and hence inflation. On the one hand, higher interest rates disincentivize consumption as they promote saving and increase financing costs. On the other hand, consumers may still desire to make up for past privations, especially on services. The ability of households to self-finance consumption affects how these two forces are balanced.
Households Still Hold Excess Personal Savings
Personal savings are defined as disposable personal income minus personal outlays. Before the pandemic, disposable income was growing at a faster rate than outlays. Hence, personal savings had a trend, which is calculated for the years 2016-2019. We then subtract this trend from actual savings to obtain a measure of excess savings. Next, we sum these excess savings to get a measure of accumulated excess savings, as shown in the figure below. Note that excess savings were computed in nominal terms, i.e., in current dollars.
This figure also shows a measure of excess inflation. Specifically, it displays the series of PCE inflation excluding energy (as shown in the first figure) minus the 2% inflation target. As we can see, excess inflation was actually negative in the years prior the pandemic, when PCE inflation excluding energy was averaging 1.6% annually.
Accumulated Excess Personal Savings and Excess Inflation
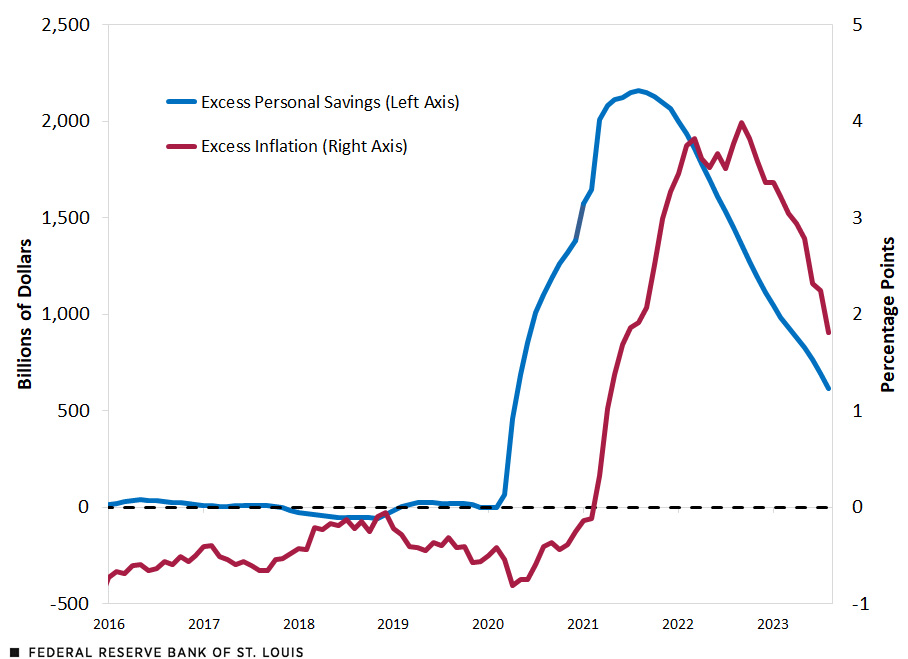
SOURCES: Bureau of Economic Analysis and author’s calculations.
NOTES: Personal savings are defined as disposable personal income minus personal outlays. Excess personal savings are computed by subtracting the 2016-2019 trend. Accumulated excess personal savings are the sum of excess personal savings since January 2016. Excess inflation is defined as the annual growth rate of the PCE price index excluding energy minus 2%.
Until the onset of the pandemic, excess savings averaged zero as both personal disposable income and outlays grew very close to their respective trends. During the pandemic, the federal government implemented three big rounds of assistance, mainly consisting of direct transfers to individuals and other forms of support that eventually made their way to households.
Accumulated excess personal savings peaked at $2.2 trillion in August 2021 and have been declining ever since. However, they still stood at over $600 billion as of August 2023. This is $150 billion more than the consumption deficit I computed above. In other words, despite the curbing incentives provided by higher interest rates, households on average have the capacity to continue consuming above trend in real terms and more than make up for pandemic-related privations.
As we can see, excess inflation traces accumulated excess savings closely but with a few months’ delay. This underscores the tight connection between fiscal policy during the pandemic and the subsequent inflation.For an articulation of economic theories connecting fiscal policy to inflation, as well as the risks for persistently high inflation surfacing at the time, see my Oct. 7, 2021, post “What Are the Risks for Future Inflation?” For example, excess savings first jumped in April 2020, with the transfers due to the Coronavirus Aid, Relief and Economic Security (CARES) Act, while inflation took off several months later. (As mentioned above and shown in the figure, inflation crossed 2% annually in March 2021). Also, accumulated excess savings peaked in August 2021, while excess inflation peaked in September 2022.
Both excess savings and excess inflation have trended down steadily since reaching their peaks, inflation a bit faster than savings, likely due to tighter monetary policy. If these recent trends were to persist, both excesses will have vanished by the end of the first half of 2024. That is, by June 2024 accumulated excess savings will have been depleted, while inflation will have fallen to 2% annually.
The Road Ahead
To recap, inflation has slowed during 2023, after two years at elevated levels, but it remains well above the Federal Reserve’s 2% target. Deflation in certain goods has helped bring average inflation down. In contrast, inflation in core services remains an item of concern as it has yet to show a marked and sustained deceleration.
Despite the Federal Reserve’s policy of high interest rates, real consumption has remained above trend, though there is still a deficit of consumption from the pandemic. Excess personal savings, boosted by fiscal policy during the pandemic, have been declining slowly but remain high enough to finance above-trend consumption, undermining the effects of tighter monetary policy.
The question remains: Will inflation continue to glide down toward 2%, or will it settle at rates above it? The latter scenario is particularly troublesome as experiencing inflation persistently above the target may erode the Federal Reserve’s credibility, which is an essential tool in the successful conduct of monetary policy.
The so-called “higher for longer” policy—that is, maintaining interest rates high even as inflation declines—is intended to ensure that the mechanism by which high interest rates curb consumption remains active until inflation is successfully brought down to the 2% target. Recent data on output and expectations of future growth have been revised upward, while the unemployment rate has remained near historic lows. These factors have provided the Federal Reserve with enough cover to focus on its fight against high inflation. They have also contributed to the recent rise of long-term interest rates. Ultimately, it is long-term interest rates (e.g., mortgage rates) that most affect consumer behavior and thus are a crucial transmission mechanism for monetary policy.
Several risks remain that could delay or potentially reverse the decline in inflation. First, energy prices have again surged, with oil currently trading at prices similar to those in late 2022. This reversal will likely arrest the momentum in headline inflation and may adversely affect inflation expectations should this rally persist.
Second, inflation in services remains stubbornly high. A simple calculation illustrates the importance of this fact. Suppose the price of goods remains constant while the price of services continues growing at its 2023 annualized rate (4.2% annual). Then, inflation for 2023 ends up at 3.2%. That is, the momentum of inflation in services is enough to keep overall inflation above target. There is the additional risk that, should this momentum persist, services may drag inflation in goods upward, rather than the other way around, as consumers coordinate their expectations on higher inflation.
Third, preliminary estimates indicated that the federal deficit was $1.7 trillion in fiscal year 2023, roughly $300 billion more than in 2022.See the Congressional Budget Office’s September budget review. Consequently, debt in the hands of the public increased by about $2.2 trillion in 2023. The debt is expected to continue growing over the next decade and beyond. An outsized increase in government liabilities, particularly when used to support direct transfers to individuals as was the case during the pandemic, may lead to a sharp rise in prices. Though the effects of pandemic expenditures are dying out, as evidenced by the slow but steady decline in excess savings, persistent large deficits may again put upward pressure on future inflation.
Notes
- This blog post is part of a series that started in April 2021 with “Is Inflation Making a Comeback?”; my most recent posts this year were the May 8 post “Understanding the Recent Behavior of Inflation”; and the May 9 post “Where Might Inflation Head?”
- For a full description of the methodology, see my Oct. 19, 2021, blog post “How Widespread Are Price Increases in the U.S.?”
- For an articulation of economic theories connecting fiscal policy to inflation, as well as the risks for persistently high inflation surfacing at the time, see my Oct. 7, 2021, post “What Are the Risks for Future Inflation?”
- See the Congressional Budget Office’s September budget review.

Citation
Fernando M. Martin, ldquoIs Inflation on the Way Out or Here to Stay?,rdquo St. Louis Fed On the Economy, Oct. 19, 2023.
This blog offers commentary, analysis and data from our economists and experts. Views expressed are not necessarily those of the St. Louis Fed or Federal Reserve System.
Email Us
All other blog-related questions