


What Does History Reveal about Reducing the National Debt Burden?
The U.S. has once again reached its debt ceiling in the first month of 2023, a limit that Congress last set at $31.4 trillion in 2021. If no action is taken, the Congressional Budget Office estimates that the U.S. could potentially face yet another debt-ceiling crisis sometime between July 1 and Sept. 30. The current debate surrounding the national debt limit is not a new one. In fact, the U.S. Treasury notes that since 1960, Congress has acted 78 times to deal with the debt limit. By examining the postwar evolution of the national debt, this post hopes to shed some light on the issue at hand.
Measuring the Debt Burden
Arguably, the level of debt held by a country is not a good measure of its indebtedness. A better indicator is the debt-to-GDP ratio. The biggest reason is that gross domestic product (GDP) measures a country’s annual output (i.e., income) and as such, the debt-to-GDP ratio reflects the country's ability to pay back its debt. This concept is analogous to the repayment ability of households as indicated by their debt-to-income ratio.
Even when using this proper measure, U.S. national debt has undeniably increased in the past 20 years, as shown in the figure below.
Total U.S. Public Debt-to-GDP Ratio Is Historically High
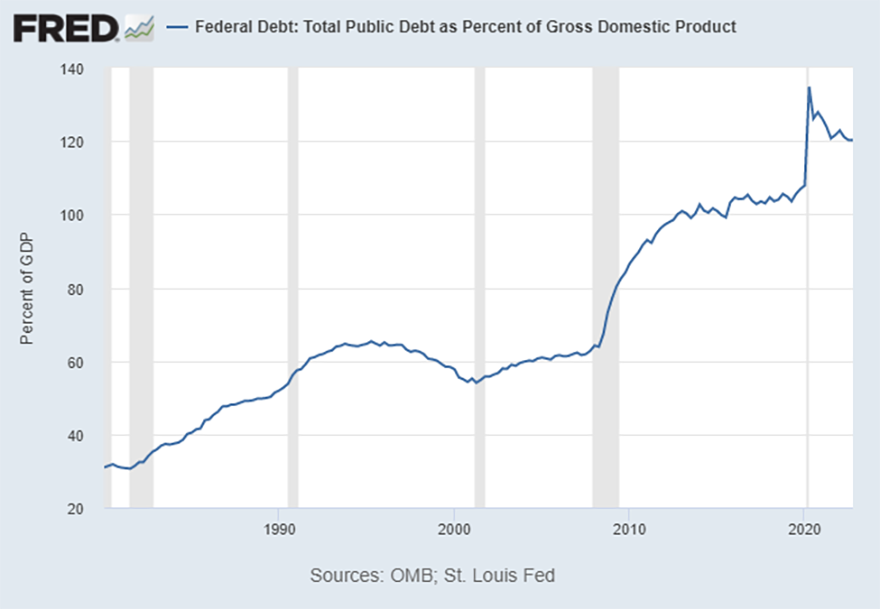
Right before the Great Recession, the U.S. debt-to-GDP ratio was hovering around 60%. Following that recession, the ratio rose to around 100%. Then, in response to the COVID-19 pandemic, the federal government increased its spending by $4.3 trillion, sending the debt-to-GDP ratio well above 120%.
Reducing the Debt-to-GDP Ratio
How could the U.S. lower its debt-to-GDP ratio in the next few decades? First, reducing the ratio does not require the level of debt to decrease. Instead, lowering the ratio could be achieved if debt experiences slower growth relative to that of GDP.
The level of nominal debt is linked to the extent of a fiscal surplus or deficit and the debt interest payment. As such, debt grows at a lower rate if the interest burden is smaller than in the previous year or the government runs either a smaller deficit or a surplus. On the other hand, the growth rate of nominal GDP is dependent on two factors: economic growth and inflation. Economic growth represents a country’s expanded ability to produce more goods and services and hence its ability to afford a higher level of debt. Meanwhile, if the inflation rate exceeds the nominal return on bonds, this results in a negative real rate of return and therefore can be viewed as a reduction in the real value of debt obligations.
Essentially, the debt-to-GDP ratio can be reduced in three ways:
- Fiscal austerity (i.e., spending cuts, tax increases or both)
- Negative real return on bonds (i.e., a nominal interest rate that is less than the inflation rate)
- Economic growth (i.e., GDP growing faster than debt)
For example, the high level of inflation after 2020 lowered the real rate of return on bonds, which ultimately led to the reduction of the debt-to-GDP ratio.
Looking Backward: What Does History Tell Us?
The U.S. has experienced a near 100% debt-to-GDP ratio before. Following World War II, the ratio reached 97.2% in 1945 as a result of war finances. Moreover, in the three decades that followed, the U.S.’s debt-to-GDP ratio significantly declined, and by 1974, it was only 16.9%, which represented a decrease of 80.3 percentage points; namely, the U.S. reduced its debt burden quite successfully during this period. This begs the question: How did the U.S. do it in just under 30 years?
George J. Hall and Thomas J. Sargent’s 2011 paper answered this question by utilizing the three above-mentioned methods of debt reduction. They found that fiscal surplus accounted for 34.7 percentage points of the total reduction. Meanwhile, a negative real return on bonds because of increased inflation accounted for 15.8 percentage points of the reduction. Finally, economic growth contributed to the reduction of the debt-to-GDP ratio by 31.8 percentage points.As Hall and Sargent’s article notes, the numbers do not sum up to the total change because of the estimate of nonmarketable debt return.
Fiscal Austerity and Economic Growth
The debt debate currently focuses on fiscal austerity—that, is whether government spending should be reduced, taxes should be increased, or both. While history tells us that increasing the fiscal surplus does reduce the debt-to-GDP ratio, it also demonstrates that higher economic growth can be another path to easing the country’s debt burden.
Note
- As Hall and Sargent’s article notes, the numbers do not sum up to the total change because of the estimate of nonmarketable debt return.


Citation
YiLi Chien and Ashley H. Stewart, ldquoWhat Does History Reveal about Reducing the National Debt Burden?,rdquo St. Louis Fed On the Economy, April 6, 2023.
This blog offers commentary, analysis and data from our economists and experts. Views expressed are not necessarily those of the St. Louis Fed or Federal Reserve System.
Email Us
All other blog-related questions