


Nominal Wage Growth at the Individual Level in 2022
Over the past year or two, the U.S. has experienced high inflation combined with strong wage growth. For households, the relative strength of these two forces determines whether their cost of living has kept up with their wages.
The first figure below compares these series—nominal wage growth and inflation—over the past decade. Both have increased dramatically in the last two years. In December 2022, for instance, median nominal wage growth was 6.1%, and consumer price index (CPI) inflation was 6.4%. We can take the difference between these two series to create an aggregate measure of real wage growth, which adjusts for the level of inflation. (See the second figure below.)
The past decade saw consistent positive real wage growth from mid-2012 through 2020. However, real wage growth was driven down—and became negative—in 2021 and 2022 because, in the aggregate, inflation outpaced nominal wage growth. However, the contributions of these components may differ across individuals or households. To explore the heterogeneity behind these negative values, we focus on nominal wage growth at the micro level in this blog post, which is the first in a two-part series. (The second post will publish next month.)
Nominal Wage Growth and Inflation
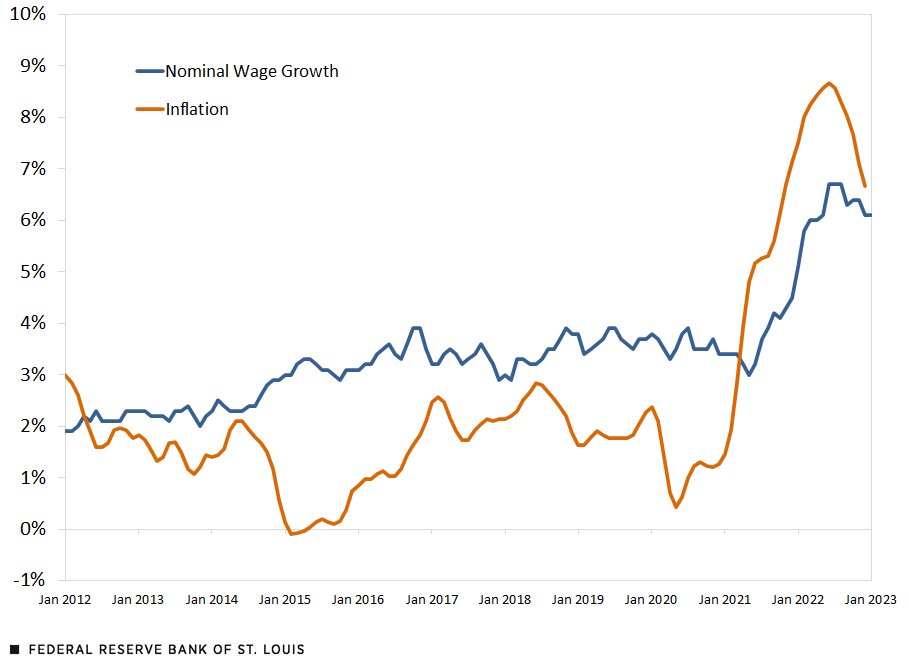
SOURCES: Federal Reserve Bank of Atlanta’s Wage Growth Tracker, Bureau of Labor Statistics and authors’ calculations.
NOTES: This figure plots the three-month moving average of inflation (measured as the year-to-year percentage change in the consumer price index) and the Wage Growth Tracker’s three-month moving average of overall unweighted nominal wage growth. The Wage Growth Tracker reports the median value.
Aggregate Real Wage Growth Rate
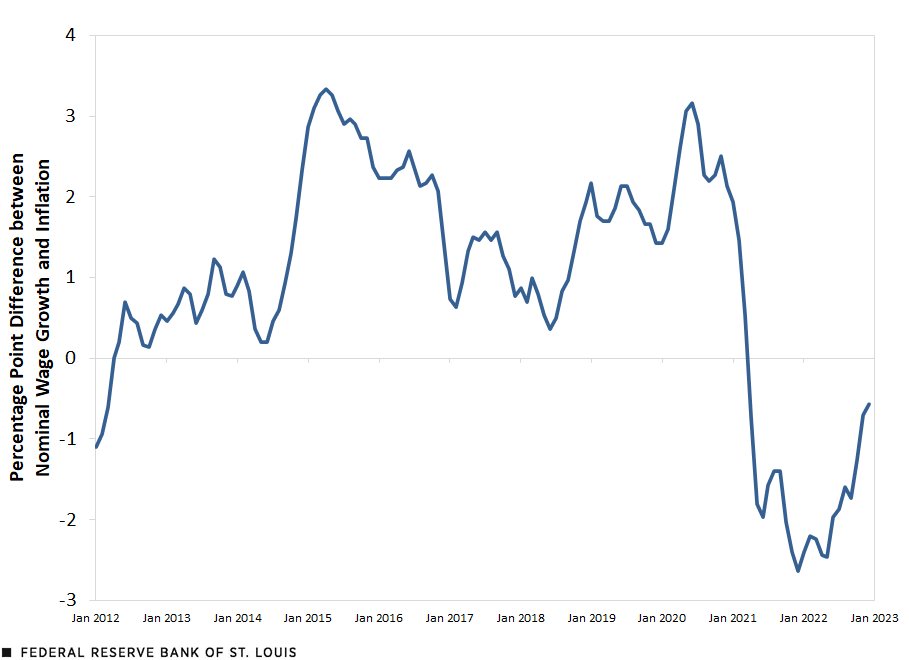
SOURCES: Federal Reserve Bank of Atlanta’s Wage Growth Tracker, Bureau of Labor Statistics and authors’ calculations.
NOTES: This figure was constructed by subtracting the three-month moving average of inflation (measured as the year-to-year percentage change in the consumer price index) from the Wage Growth Tracker’s three-month moving average of overall unweighted nominal wage growth. The Wage Growth Tracker reports the median value.
Nominal Wage Growth at the Individual Level
To calculate nominal wage growth at the micro level, we used data from the Current Population Survey (CPS), a monthly survey conducted by the Bureau of Labor Statistics that collects information on the labor force and demographic characteristics. The CPS interviews individuals for four consecutive months each year and elicits earnings information twice, 12 months apart, for each respondent.
Following the methodology of the Federal Reserve Bank of Atlanta and its Wage Growth Tracker, we calculated the hourly wage of individuals at their main jobs between 2021 and 2022. If they did not receive an hourly wage at their main jobs, we calculated an hourly wage using their weekly earnings and usual hours worked per week. This value can be measured only for individuals working in both months that they are asked about their earnings. For each individual, we calculated the year-to-year percentage change in wages from 2021 to 2022. The next figure plots the distribution of nominal wage growth rates.
Distribution of Nominal Annual Wage Growth Rates, 2022
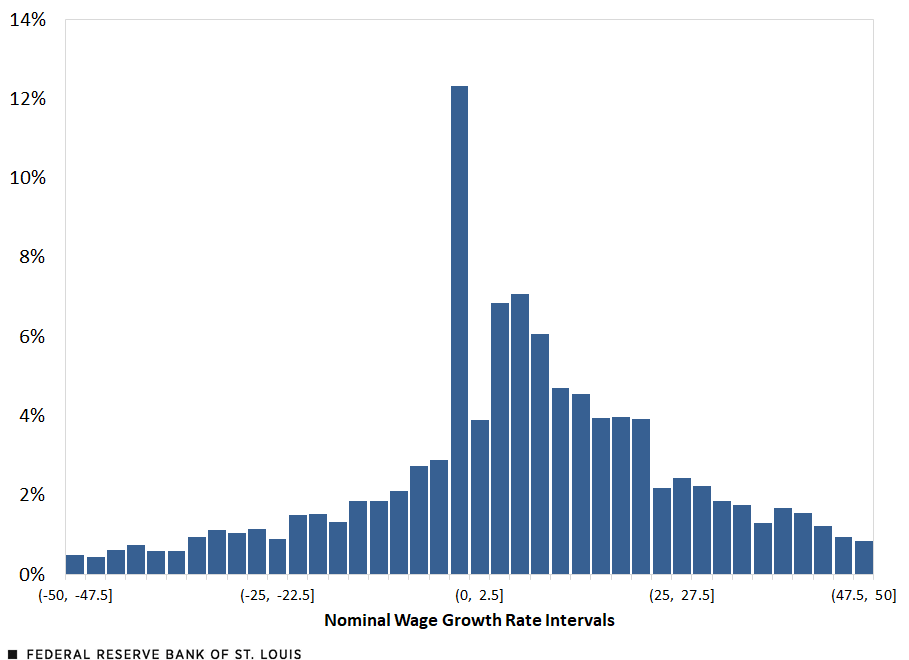
SOURCES: Current Population Survey data and authors’ calculations.
This distribution of nominal wage growth has two important characteristics. First, there is a large mass point at zero, which suggests that many workers have experienced “wage stickiness” in the past year: Their wages did not change at all. Second, the wide range in the distribution suggests that some have experienced very large wage changes. To see which workers experienced the most and least nominal wage growth between 2021 and 2022, we examined growth rates by income decile, which are plotted in the figure below.
Nominal Wage Growth Rate by Wage Decile
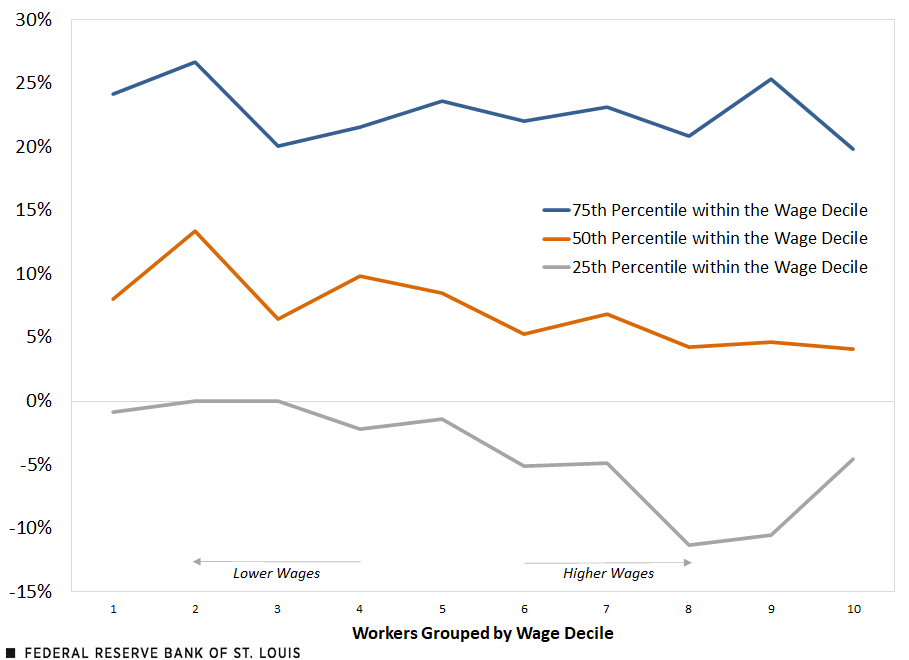
SOURCES: Current Population Survey data and authors’ calculations.
NOTES: This figure was created by plotting the 25th percentile (lower), 50th percentile (median) and 75th (higher) percentile nominal wage growth rates at 10 wage deciles. The growth rates are the year-to-year percentage change between 2021 and 2022.
The figure demonstrates that the lowest-wage workers (at the first wage decile on the far left of the x-axis) experienced some of the highest nominal wage growth rates. For them, only the 25th percentile (those at the lower end of wage growth within this wage decile) saw negative nominal wage growth. The median lowest-wage worker saw their nominal wages grow by around 7% over the last year.
High-wage workers (those at the top 3 deciles), on the other hand, experienced lower nominal wage growth, as well as a wider range of nominal wage growth rates. These workers at the 50th percentile saw about 4% wage growth, and it is clear that a lot more high-wage workers than low-wage workers experienced nominal wage declines.
The Need to Account for Inflation at the Individual Level
Overall, median nominal wage growth rates remained positive across all wage deciles, especially for lower-wage workers. However, we have not yet taken into account how inflation cuts into these households’ incomes. In particular, households at different points in the income distribution may experience inflation differently.
In the second post of this series, we will continue to examine trends in real wage growth by examining its second component—inflation rates—at the micro level, allowing us to uncover which demographic groups have experienced the highest and lowest real wage growth over the last year.


Citation
Victoria Gregory and Elisabeth Harding, ldquoNominal Wage Growth at the Individual Level in 2022,rdquo St. Louis Fed On the Economy, Feb. 23, 2023.
This blog offers commentary, analysis and data from our economists and experts. Views expressed are not necessarily those of the St. Louis Fed or Federal Reserve System.
Email Us
All other blog-related questions