


Community Development Publications and Reports
Featured Publications
-

Health Care Opportunity Occupations and Workforce Strategies in U.S. and Eighth District Hospitals
Which health care jobs will be most in demand over the coming years? What are hospitals doing to sustain their workforces? Six “opportunity occupations”—like certain nursing and clinical technician roles—offer above-median wages without a four-year degree. Such jobs are an avenue for recent high school graduates in rural and metro areas alike to pursue stable careers or for older workers to reskill. This report uses employment and survey data to examine opportunities and approaches for strengthening the health care workforce across our region.
-

Access to Credit and Financial Services: A Bridge to Financial Well-being
Access to banking services and traditional credit is essential for financial well-being. This two-part analysis first examines credit scores by income level to measure credit access in the U.S. and the Fed’s Eighth District, then analyzes 12 roundtable discussions held with community members in 2025 to map how those with low and moderate incomes access and utilize transaction accounts and credit.
-

Disconnected Young Adults: A Look at the Eighth Federal Reserve District
How are high levels of economic disconnection among young adults nationwide reflected in our region? Our 2024 report examines young adults who are neither in school nor working by geography, race, education and income to better understand who makes up this population, their labor market experiences and what barriers to greater economic participation they may face.
-
Published 2017-Current
Explains everyday economics and the Fed, while also spotlighting St. Louis Fed people and programs. Community Development publishes articles about economic development and economic equity and inequality in this blog.
-
Published 2014-Current
Offers frequent commentary, analysis and data from our economists and other St. Louis Fed experts. Community Development authors cover topics like economic development and economic equity and inequality in this blog.
-
Launching a Community Development Project
Published 2016
This guide from the St. Louis Fed can help you navigate the process of putting together community development projects and identify funding for projects.
-
Economic Impact of Child Care by State
Published April 15, 2025
Get child care data for all 50 states, including affordability estimates, labor force participation rates and statistics about workforce-related struggles facing child care providers. Fact sheets prepared by Federal Reserve Bank of St. Louis researchers.
-
The State of U.S. Household Wealth
Last updated June 2025
View quarterly data based on the average, inflation-adjusted household wealth of various demographic groups in the U.S. The report seeks to quantify the magnitude of U.S. wealth gaps over time, an important step toward understanding why such differences persist.
-
Published 2018-Current
The Bank On movement is designed to improve the financial stability of America’s unbanked and underbanked. Metrics from financial institutions related to account openings, account usage and consistency, and online access are aggregated and released annually.
-
Community Development Outlook Survey
Published October 2011-2023
Fielded by our Community Development department, this survey monitors the factors affecting low- and moderate-income communities in the Fed’s Eighth District.
-
Published November 2022-Current
The Community Perspectives Survey is a national survey aimed at reporting the economic conditions of LMI communities and the health of the organizations serving them.
-
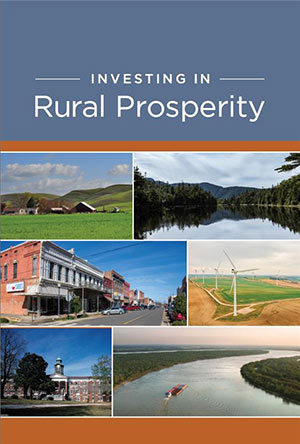
Published 2021
Rural communities that support inclusive development and tap into the potential of all their residents will have a competitive advantage in the economy of the future. This book offers ideas for how rural communities can pursue growth that leads to greater economic opportunity for everyone.
-
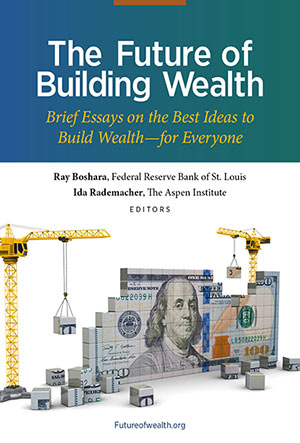
The Future of Building Wealth: Brief Essays on the Best Ideas to Build Wealth—For Everyone
Published 2021
The book highlights the boldest and forward-looking ideas for rebuilding or building family balance sheets.
Request Your Copy.
-
Published 1997-2023
This regular review covered regional community and economic development issues, projects and regulatory changes. It was geared toward practitioners from community-based organizations, as well as for Community Reinvestment Act officers, academics and government officials.
-
Innovative Approaches to Investing with Impact in St. Louis (PDF)
Published April 2019
One of today’s biggest barriers to engagement in impact investing in St. Louis is a lack of awareness. This report provided an overview of impact investing throughout St. Louis and emerging impact investing structures across the U.S., such as Pay for Success and Opportunity Zones. Also view the 2018 report (PDF).
-
Investing in America’s Workforce: Report on Workforce Development Needs and Opportunities (PDF)
Published 2017
This report analyzed information gathered from nearly 1,000 leaders who work at the intersection of workforce training, recruitment and finance. The study provided a snapshot of the workforce development sector and its key challenges. It offered strategies for improving the human capital of America’s labor force, expanding access to jobs and innovating workforce development funding.
-
Published August 2012-January 2021
These research-based essays focused on understanding and strengthening the balance sheets of American households.
-
Tipping Points Household Debt Research Symposia
Published 2016-2018
The St. Louis Fed’s Center for Household Financial Stability and the Private Debt Project hosted three events centered on the question of ”tipping points”: How and when does household debt move from being wealth-building and productive for households and the economy to being wealth-depleting and destructive for both? Topics included micro-level effects of household debt; the macro effects of family debt; and the evolution of debt-financed homeownership.
-
Published 2015-2018
This essay series by the St. Louis Fed’s Center for Household Financial Stability was based on an analysis of more than a quarter-century’s worth of data collected by the Federal Reserve through its Survey of Consumer Finances. The series confirmed the conventional wisdom that more education is associated with more income and wealth. It also showed that inherited demographic characteristics—one’s race or ethnicity, age and birth year, and even parents’ level of education—profoundly shape economic and financial opportunities and outcomes.
-
Workforce Development Survey Results
Published 2015
In 2015, the St. Louis Fed distributed a survey to collect data about workforce development trends that affect low- and moderate-income individuals and households in the St. Louis area.
-
Economic Effects of the 1918 Influenza Pandemic: Implications for a Modern-day Pandemic (PDF)
Published March 2009
In 1918, the United States experienced the most serious epidemic in its history. Millions of people were infected with the highly contagious influenza virus, and hundreds of thousands of people died. The possibility that a modern-day influenza outbreak could happen has caused researchers to look back to the 1918 pandemic as a foundational model for the likely effects of such an event on the United States. However, there has been relatively little research done on the economic effects of the pandemic. This report by St. Louis Fed economist Thomas A. Garrett provided a concise discussion and analysis of the economic effects of the 1918 influenza pandemic based on available data and research.
Archived Community Development booklets, guides, and brochures and reports and research can be found on FRASER, the digital library of economic history.