


Community Investment Explorer
On this page: About | Regional Maps | Use Cases | Data | Definitions | Calculations | Downloads | Notes
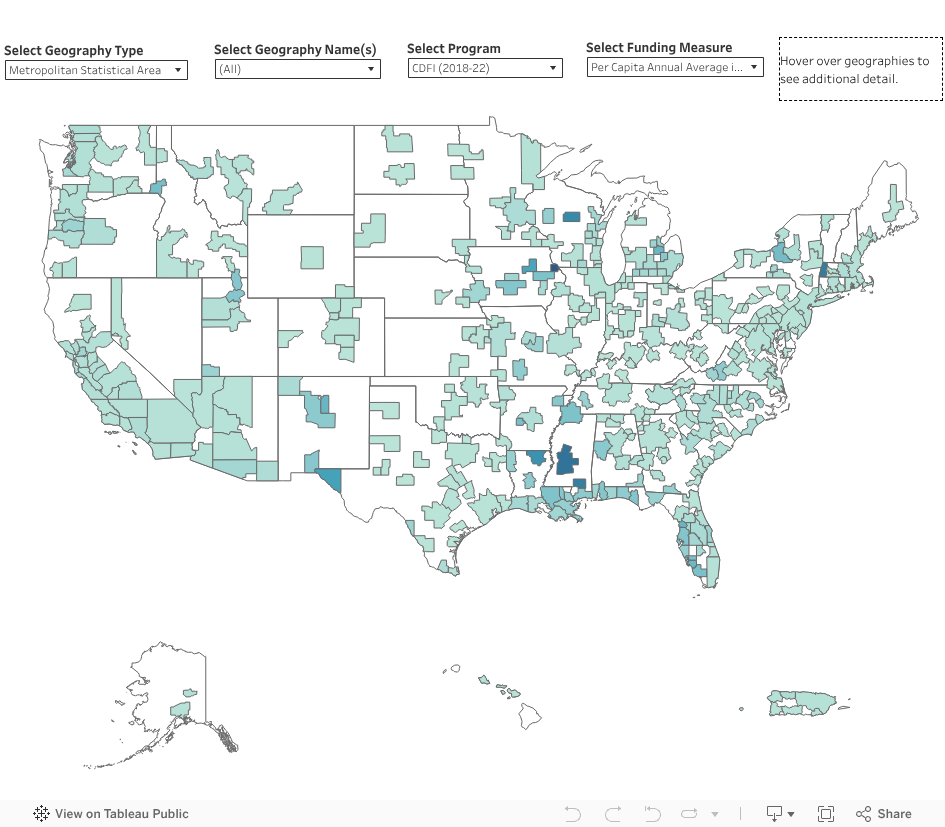
Community Investment Explorer (CIE) is an interactive tool for examining the distribution of community and economic development capital at the state, regional and neighborhood levels. Use the dropdowns on the U.S. map below to filter data by geography, program and capital funding measure. Hover over an area to view additional information.
More ways to view the data:
About CIE
CIE includes more than 3 million transactions totaling over $2.2 trillion in community and economic development capital from nine federal programs (see notes) over a five-year period, primarily 2018-22. Data are based on the location of the project or the recipient of the funds (e.g., the affordable housing development, small business owner or consumer), not the capital provider. The tool has a variety of measures by which to compare metro areas and the rural portions of states. CIE also allows users to examine the distribution of capital and trends in low- and moderate-income neighborhoods.
State, Regional and Neighborhood Data on Community Capital
A deeper look at capital flows by neighborhood is available for the following Eighth Federal Reserve District metro areas:
Ways to Use the CIE Tool
Use the CIE tool to better understand your community, inform decisions and allocate your resources more effectively.

Small Business Development Centers (SBDCs): SBDCs can utilize CIE to understand small business lending patterns, via the tool’s SBA 7(a) and 504 lending data, in their region and to help small business clients tailor their financing strategies accordingly. SBDCs can also access the SBA source data to understand which lenders are most active in their area.
Affordable Housing Developers: Affordable housing developers can utilize CIE data on Low-Income Housing Tax Credits combined with market analysis to determine where affordable housing demand is strong but investment is limited. Developers focused on housing preservation can pair Low-Income Housing Tax Credit data with Historic Tax Credit funding patterns.
Financial Institutions: Financial institutions can utilize CIE to understand financing gaps that may exist in low- and moderate-income census tracts within their CRA assessment areas through the CDFI, New Markets Tax Credit, Historic Tax Credit and Low-Income Housing Tax Credit programs.
Community Development Financial Institutions (CDFIs): CDFIs can utilize CIE data to better understand their market share relative to their peers while also identifying financing gaps within their target market areas.
State and Local Government Agencies: Public officials for states and municipalities can utilize CIE data on Community Development Block Grants and Home Investments Partnership grants to understand which communities are receiving funding and how the distribution of grants by neighborhood characteristic compares with peer regions.
Researchers: CIE gives researchers a comprehensive dataset to explore how funding through various programs is related to a variety of outcomes, such as whether there is a relationship between CRA small business lending and/or SBA lending and small business formation rates, the effects of affordable housing capital flows on the rate of households considered housing-cost burdened, and the local economic impact of CDFI lending and investment—among many other topics. Data can be merged with source-level data by geography to include information about the use of funds, the capital provider (in some cases), and more.
Data Sources
To generate estimates based on the low- and moderate-income (LMI) neighborhood characteristic, CIE merges census tract-level identifiers from the capital flows datasets with demographic and socioeconomic data from the Federal Financial Institutions Examination Council (FFIEC) 2024 Census Flat File, which primarily draws from the 2016-20 American Community Survey. For additional information, see the associated FFIEC documentation.
The tool combines these data with the core-based statistical area, metropolitan division and combined statistical area delineation files (updated July 2023) to generate corresponding metropolitan statistical area (MSA), micropolitan statistical area (micro area) and rural area (neither an MSA nor micro area) information. To generate population estimates for MSAs and micro areas, the tool merges data from the U.S. Census Bureau’s 2023 population estimates with the capital flows data. To generate population estimates for LMI areas, it utilizes population estimates from the FFIEC 2024 Census Flat File.
All capital flows are based on the 2020 census tract boundaries. When necessary, census tracts have been converted to 2020 boundaries using the IPUMS National Historical Geographic Information System 2010-20 Census Tract Crosswalk and population weights. The exception is Low-Income Housing Tax Credit data, which are weighted by housing units.
Neighborhood names, which are visible in the regional maps and the downloadable dataset, are based on data from Google Maps and were acquired via Opportunity Atlas.
Community Development Block Grant (CDBG) program: U.S. Department of Housing and Urban Development, Office of Policy Development and Research. CDBG Activity. Retrieved on June 11, 2024.
Community Development Financial Institution (CDFI) program: U.S. Department of Treasury, CDFI Fund. 2022 CDFI Program Awardee Data Release, Documentation and Instructions; 2021 CDFI Program Awardee Data Release, Documentation and Instructions; 2020 CDFI Program Awardee Data Release, Documentation and Instructions; 2019 CDFI Program Awardee Data Release, Documentation and Instructions; 2018 CDFI Program Awardee Data Release, Documentation and Instructions. Retrieved on Dec. 5, 2024.
Community Reinvestment Act (CRA) small business lending: Federal Financial Institutions Examination Council (FFIEC). CRA Disclosure Flat Files (2018-22). Retrieved on Nov. 1, 2024.
Historic Tax Credit program: Historic Tax Credit Projects in Fiscal Years 2018-2022. PolicyMap (based on data from the National Park Service). Retrieved on June 11, 2024.
Home Investments Partnership (HOME) program: U.S. Department of Housing and Urban Development, Office of Policy Development and Research. HOME Program Activity. Retrieved on June 11, 2024.
Low-Income Housing Tax Credit (LIHTC) program: U.S. Department of Housing and Urban Development, Office of Policy Development and Research. Low-Income Housing Tax Credit Database. Retrieved on Jan. 9, 2025.
New Markets Tax Credit (NMTC) program: U.S. Department of Treasury, CDFI Fund. FY 2024 NMTC Public Data Release: 2003-22 Data File. Retrieved on Dec. 5, 2024.
SBA 7(a) program: Small Business Administration, Office of Capital Access. FOIA-7(a)(FY2010-FY2019) and FOIA-7(a)(FY2020-Present). Retrieved on June 11, 2024.
SBA 504 program: Small Business Administration, Office of Capital Access. FOIA-504(FY2010-Present). Retrieved on June 11, 2024.
Definitions
Census tract: Census tracts are small, relatively permanent statistical subdivisions of a county or equivalent entity that are updated by local participants prior to each decennial census (every 10 years). They generally have a population of 1,200 to 8,000 with an optimum size of 4,000 people.
Community Reinvestment Act (CRA): A 1977 U.S. federal law that encourages financial institutions to help meet the credit needs of communities in which they operate, including low- and moderate-income neighborhoods.
Core-based statistical area (CBSA): Term that refers to metropolitan statistical areas and micropolitan statistical areas collectively.
Low- and moderate-income (LMI): Census tracts in which the median family income is below 80% of the area median income.
Metropolitan statistical area (MSA): Geographic area defined by the Office of Management and Budget that includes at least one urbanized area of 50,000 or more inhabitants.
Micropolitan statistical area (micro area): Geographic area defined by the Office of Management and Budget that includes at least one urban cluster of at least 10,000 but fewer than 50,000 inhabitants.
Statewide rural: The portions of a state outside core-based statistical areas.
Community Development Block Grant (CDBG) program: Administered by the U.S. Department of Housing and Urban Development (HUD), the CDBG program provides annual grants on a formula basis to states and cities to support decent housing and a suitable living environment and to expand economic opportunities, principally for those with low and moderate incomes.
Community Development Financial Institution (CDFI) program: Administered by the U.S. Department of Treasury’s CDFI Fund, the CDFI program provides financial products and services to individuals and organizations that face obstacles to accessing capital from mainstream financial institutions.
Community Reinvestment Act (CRA) small business lending: Small business loans, as measured by loans to businesses with revenue below $1 million, reported by bank lenders pursuant to CRA requirements.
Historic Tax Credit program: Administered by the U.S. Department of the Interior’s National Park Service (NPS) and the Internal Revenue Service (IRS), the Historic Tax Credit program provides a tax credit for the rehabilitation of historic, income-producing buildings that are determined by NPS to be “certified historic structures.”
Home Investments Partnership (HOME) program: Administered by HUD, the HOME program provides grants on a formula basis to states and localities that support the creation or preservation of affordable housing.
Low-Income Housing Tax Credit (LIHTC) program: Administered by HUD and the IRS, the LIHTC program provides states and local LIHTC-allocating agencies an annual budget authority to issue tax credits for the acquisition, rehabilitation or new construction of rental housing targeted to households with lower incomes.
New Markets Tax Credit (NMTC) program: Administered by the U.S. Department of Treasury’s CDFI Fund, the NMTC program attracts private capital into low-income communities by permitting individual and corporate investors to receive a federal income tax credit in exchange for making qualified equity investments (QEIs) in certified financial intermediaries called community development entities (CDEs).
SBA 7(a) program: Administered by the SBA, the 7(a) program provides financial assistance, such as loans and guarantees, to small businesses.
SBA 504 program: Administered by the SBA, the 504 program provides long-term, fixed-rate financing of up to $5 million for major fixed assets that promote business growth and job creation.
Calculations
Annual average in all tracts: Per-year average funding amount in all the census tracts of a given region over the five-year period (2018-22) in which data was collected and analyzed.
Annual average in LMI tracts: Per-year average funding amount in LMI census tracts of a given region over the five-year period (2018-22) in which data was collected and analyzed.
Funding-to-population ratio in LMI tracts: Percentage of a region’s total funding or investment that goes to LMI census tracts compared with the percentage of the region’s overall population living in those same LMI census tracts.
Per capita annual average in all tracts: Per-year average funding amount per person for a given region.
Per capita annual average in LMI tracts: Per-year average funding amount per person living in a region’s LMI census tracts.
Share of funding in LMI tracts: Percentage of funding in a region’s LMI census tracts divided by the total amount of funding a region received.
Data Download
Files available for download:
- Aggregated Data: All Programs and Geographies (.csv)
- Aggregated Data: All Programs and Geographies by Year (.csv)
- CDBG and CDFI Programs by Year and by Census Tract (.csv)
- CRA Small Business, SBA 504 and 7(a), HOME, HTC, LIHTC and NMTC Programs by Year and by Census Tract (.csv)
- Amounts are adjusted for inflation (2022 dollars) using the Federal Reserve Bank of Minneapolis inflation calculator.
- Community Reinvestment Act (CRA) small business lending captures the small business lending activity by banks and is technically not a government program; all other funding streams represent federal programs.
- All data are based on individual transactions, with the exception of CRA small business lending data and a portion of the CDFI data, which are aggregated by census tract from the FFIEC.
- CIE includes a sample of community and economic development capital flows. Data were included in the tool because they met both the following criteria: 1) The programs have an explicit or implicit objective of promoting community development and/or economic development, and 2) data are available by census tract. Tract-level data are important to understanding capital flows by income level because low- and moderate-income census tracts serve as a basis for the CRA.
- Six states (Connecticut, Delaware, Hawaii, Massachusetts, New Jersey and Rhode Island) plus the District of Columbia do not have any census tracts located outside of a core-based statistical area, which is how rural portions of a state is defined in CIE. Therefore, the statewide rural map will not show these states and Washington, D.C.
- The four regional maps represent the largest MSAs (by population) in the Eighth Federal Reserve District. Each map includes capital flows by neighborhood for the three largest counties within the MSA. The neighborhood names, which are visible in the regional maps and the downloadable dataset, are based on data from Google Maps and were acquired via Opportunity Atlas.
- The vast majority of data are based on transactions closed in a calendar year. However, for Historic Tax Credits and a portion of the Community Development Financial Institution (CDFI) dataset, data are only available for fiscal years. This results in an approximation of capital flows per calendar year, but it is not exact.
- Low-Income Housing Tax Credits are based on the tax credit allocation amount.
- CDFI Fund data are a combination of data reported through the Transaction Level Report (TLR) and the Consumer Loan Report (CLR). They represent a sample of all CDFI lending and investing activity, as only CDFIs that receive a grant from the CDFI Fund are required to report their loans and investments on the TLR and CLR. The CLR includes data aggregated at the census tract level rather than on individual transactions, and it is available for fiscal years (as referenced above) rather than a calendar year or a specific date. Because CDFI data are based on a sample of institutions that receive grants from the CDFI Fund, the composition of the sample can change over time, which may affect funding trends observed.
- SBA 7(a) amounts are based on the guaranteed approval amount.
- SBA 504 amounts are based on the gross approval amount because the guaranteed approval amount is not available.


