

Housing Rebound Broadens the Wealth Recovery But Much More is Needed
The Federal Reserve Board reported Sept. 25 that total household net worth reached $74.8 trillion in current dollars at the end of the second quarter of 2013. Household wealth has increased 35 percent from its recessionary nadir at the end of the first quarter of 2009 and now stands 8.4 percent higher than its pre-recession peak of $69.0 trillion at the end of the third quarter of 2007 (Figure 1).
When adjusted for inflation and growth in the number of households, however, average real net worth has recovered only 76 percent of the loss incurred between 2007 and 2009. The slow recovery of wealth is due primarily to housing, which only began to rise in value at the beginning of 2012. The faster recovery of financial assets mainly has benefited wealthier families, who own most of the economy’s stocks and other financial assets. In this article, we show that the nascent housing recovery appears to reflect rising prices of relatively more expensive houses. This also likely benefits wealthy families more than those who own lower-value houses or are renters.
Housing Recovery Underway
For the sixth consecutive quarter, rising house prices contributed strongly to overall household wealth recovery. The total value of owners’ equity in household real estate (henceforth, homeowners’ equity) reached $9.3 trillion at the end of the second quarter of 2013, up 50.1 percent since the fourth quarter of 2011 and the highest level in more than five years.[1] In dollar terms, the $3.1 trillion increase in homeowners’ equity since the end of 2011 nearly matches the $4.1 trillion increase in households’ stock-market equity shares during the same time period.
Despite the strong recovery to date, housing values and homeowners’ equity remain far below peak levels. After adjusting for inflation and growth in the number of homeowners, average homeowners’ equity at the end of the second quarter of 2013 (about $125,000) was slightly less than the value achieved in the second quarter of 2000, some 13 years ago (Figure 2). Inflation-adjusted per-capita disposable personal income, by way of comparison, increased 16.7 percent during that time. The current average inflation-adjusted value of homeowners’ equity remains 38.3 percent lower than its peak value in early 2006, although that is a significant improvement from the end of 2011, when the value was 58.6 percent lower than peak value.
Uneven Distribution of Housing Wealth Gains
Even more important than inflation and growth adjustments, the distribution of house-price gains - that is, which house prices are increasing faster and which slower - determines how broad the housing-driven wealth recovery will be. One way to gauge how widespread house-price increases have been is to compare two different kinds of house-price indexes: value weighted and equal weighted.[2] Examples of the former are the CoreLogic Home Price Index and the S&P/Case-Shiller Home Price Index.[3] Examples of the latter include a variety of indexes compiled by the Federal Housing Finance Agency (FHFA); we focus on the FHFA’s expanded data house-price index.[4] All three provide very broad nationwide coverage and are comparable except for how they weight individual house prices.
The value-weighted indexes assign relatively more weight to more expensive homes - that is, a home’s market value determines its contribution to the index—while the equal-weighted indexes treat all homes the same, regardless of how expensive they are. If the prices of all houses of all values are changing at the same rate, both types of index will yield the same result. On the other hand, if the prices of high-value houses are rising faster (or slower) than the prices of low-value houses, the value-weighted indexes will show faster (slower) rates of appreciation.
For example, suppose there were only three houses in a market, valued originally at $100,000, $200,000 and $300,000. Assume that only the value of the $300,000 house changed, and it doubled in price. A value-weighted index would show a 50 percent increase in house prices ($600,000 in total housing value had increased to $900,000), while the equal-weighted index would show a 33 percent increase (calculated as the average of two zero percent gains and one 100 percent gain). Although only the value-weighted index captures the total wealth change in the market, the equal-weighted index is more representative in the sense that the two families with unchanged house prices find the 33 percent gain closer to their own experience than a 50 percent gain. Moreover, the median family (with a $200,000 house) also perceives the equal-weighted price gain as closer to its own experience.
Figure 3 plots two inflation-adjusted value-weighted national home-price indexes (CoreLogic and Case-Shiller) against an inflation-adjusted equal-weighted national house-price index (FHFA expanded data), setting their respective values equal to 100 in the first quarter of 2000. The value-weighted indexes were more volatile over the period shown, rising roughly twice as high as the FHFA index by 2006, then falling much more in percentage terms through the end of 2011, when they all reached their low points. We therefore can infer that, on average, higher-priced houses rose and fell by greater percentages than lower-priced houses. For example, many high-value homes in California increased by large percentages before falling by large amounts, while many low-value homes in Midwest states like Missouri increased and decreased by smaller percentages.
There are two relevant features of the chart for judging the distribution of gains in the nascent housing recovery to date. First, at the trough in late 2011, the equal-weighted FHFA index was noticeably lower than either of the value-weighted indexes, even though they all began at 100 in early 2000. We can infer that, on balance, the net percentage price change between 2000 and 2011 was greater for higher-value homes than for lower-value homes because value-weighted indexes represent higher-value homes’ price movements more closely.
The second important fact is that the value-weighted indexes have increased more sharply since the 2011 trough than the equal-weighted index. In particular, the inflation-adjusted CoreLogic and Case-Shiller indexes have increased by 12.7 and 11.8 percent, respectively, since the end of 2011. During the same period, the inflation-adjusted FHFA index increased by just 8.3 percent. Thus, higher-value homes generally have appreciated faster than lower-value homes.
Putting together these two facts, we conclude that lower-value homes - such as the $100,000 and $200,000 houses in our example - generally fell to a deeper trough in 2011 and subsequently have recovered more slowly than their higher-value counterparts. The equal-weighted FHFA index better represents the experience of the typical homeowner than do either of the value-weighted indexes or the Fed’s estimate of household real-estate values, which essentially is a value-weighted index.
High-Price States vs. Low-Price States
Figure 4 compares the typical house-price experience of a California homeowner to that of a Missouri homeowner. The median house value in California in 2000 was about $334,000, versus about $148,000 in Missouri (both expressed in terms of 2012 dollars), so the figure compares the typical experience in a relatively high-priced state to that in a relatively low-priced state.[5] The figure sets both states’ 2000 values equal to an index value of 100 to illustrate cumulative percent changes after that date. The figure shows that California (higher-value) houses experienced more volatility, settled in 2011 at a slightly higher level and have increased in value more sharply than Missouri (lower-value) houses through mid-2013.
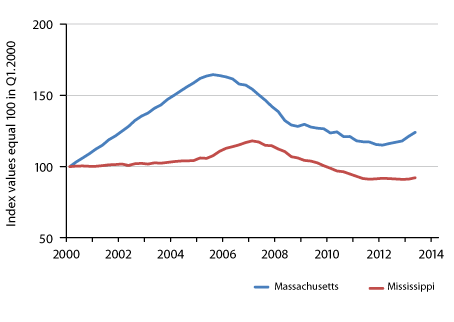
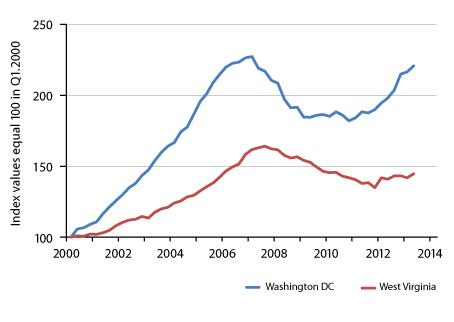
Figure 5 compares two other states with relatively high and low house prices. The median house price in Massachusetts in 2000 was about $288,000, while the median house price in Mississippi was about $156,000, both expressed in terms of 2012 dollars. Figure 6 compares Washington, D.C. (with a median house price of $311,000 in 2000) to West Virginia (where the median house price was $128,000 in 2000), both expressed in terms of 2012 dollars. Many other such comparisons are possible.
The common pattern in Figures 4, 5 and 6 is consistent with the conclusion we drew from Figure 3 that the house-price recovery since the end of 2011 has been stronger among higher-value houses, not just in California but throughout much of the nation. The same is also true within many local markets. The price recovery to date often has been stronger for higher-value houses.
Wealth Recovery Uneven across American Families
If families facing more difficulty rebuilding their wealth today are more likely to own lower-value houses or to be renters, Figures 3 through 6 together suggest that the value of their homes may have increased less than the (value-weighted) national average (or none at all, if they rent). Therefore, the housing recovery to date likely has been of limited benefit to them. Just as stock-market gains have largely accrued to wealthier families, a significant share of housing-wealth gains to date also likely have benefited owners of higher-value homes who are likely to have above-average wealth.
A broad-based housing recovery will be necessary to restore the wealth lost by the typical home-owning family because homeownership, unlike stock-market investment, typically is a non-wealthy family’s largest investment. The recent recovery in house prices and homeowners’ equity therefore is good news, but much more will be needed for the typical homeowner to recover fully from the deep wealth losses experienced in recent years.
Measures of Household Wealth

SOURCES: Federal Reserve Board, Bureau of Economic Analysis, Census Bureau.
Average Inflation-Adjusted Homeowners' Equity

SOURCES: Federal Reserve Board, Bureau of Economic Analysis, Census Bureau.
Inflation-Adjusted National House-Price Indexes

SOURCES: CoreLogic, Standard & Poor's, Federal Housing Finance Agency, Bureau of Economic Analysis.
Inflation-Adjusted Equal-Weighted House-Price Indexes

SOURCES: Federal Housing Finance Agency, Bureau of Economic Analysis.
Inflation-Adjusted Equal-Weighted House-Price Indexes
SOURCES: Federal Housing Finance Agency, Bureau of Economic Analysis.
Inflation-Adjusted Equal-Weighted House-Price Indexes
SOURCES: Federal Housing Finance Agency, Bureau of Economic Analysis.
Endnotes
- Financial Accounts of the United States, http://www.federalreserve.gov/releases/z1/. These figures are not adjusted for inflation or population growth. Total homeowners’ equity is the total value of all U.S. household real estate minus all outstanding home-mortgage debt. It constituted 12.4 percent of total household net worth at the end of the second quarter of 2013.[back to text]
- All of the house-price indexes discussed here are repeat-sales indexes, which are designed to control for quality differences among individual homes, including size, amenities and location.[back to text]
- For details see http://www.corelogic.com/about-us/researchtrends/home-price-index-report.aspx and http://us.spindices.com/index-family/real-estate/sp-case-shiller. In between biennial benchmarkings to Census Bureau data, the Federal Reserve uses quarterly changes in the CoreLogic value-weighted index to estimate the total value of household real estate in its Financial Accounts. This is because the data reported in the Financial Accounts are conceptually similar to value-weighted indexes.[back to text]
- See http://www.fhfa.gov/?Page=14.[back to text]
- Federal Housing Finance Board.[back to text]


In the Balance are short essays related to research on understanding and strengthening the balance sheets of American households. Views expressed are not necessarily those of the St. Louis Fed or Federal Reserve System.
Email Us
