


How Have U.S. Workers Fared in a Labor Market Reshaped by the Pandemic?
The Beveridge curve illustrates the relationship between the job openings, or vacancy, rate (an indicator of labor demand) and the unemployment rate (an indicator of labor supply). This curve, which has historically been downward sloping, reflects the efficiency of the job matching process. Movements along this curve provide information about the labor market’s health and the economy’s position in the business cycle.
Between 2022 and the first half of 2024, the U.S. labor market was exceptionally tight, characterized by historically low unemployment rates and high job openings rates. But by late 2024, signs of softening began to emerge. (See the figure below.) It is noteworthy that the points in the second half of 2024 are close to the January 2010-March 2020 curve, suggesting that the overall job match relationship returned to its prepandemic position.
The COVID-19 Pandemic Caused Significant Shifts in the Beveridge Curve
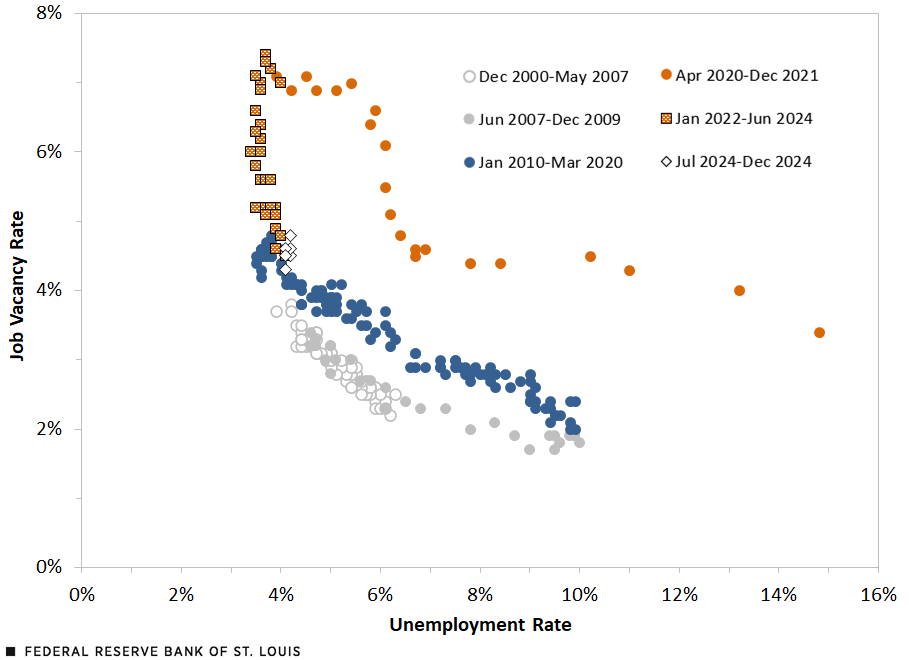
SOURCES: Bureau of Labor Statistics and authors’ calculations.
This post uses the Beveridge curve to explore how different groups of workers experienced the labor market during this period.
We examined workers by various demographic characteristics: by sex (men and women), by race and ethnicity (white, Black, Hispanic or Latino, Asian, American Indian and Alaska Native, and other or mixed races), by education (high school dropouts, high school graduates, some college and at least a college degree), by geography (principal city, suburban and rural), by recent experience in the labor market (new entrants), by income and by age. We also looked at women with children, people who were born in the U.S., and those who were U.S. citizens regardless of place of birth.
In addition, our analysis included groups with a specific mix of demographics: Black new entrants, Hispanic or Latino new entrants, new entrants living in a principal city with no more than a high school diploma, suburban new entrants with no more than a high school diploma, and rural entrants with no more than a high school diploma. Finally, we also examined out-of-school young people (18- to 24-year-olds who are neither in school nor working) with no more than a high school diploma and people with a disability.
Did everyone benefit equally from the tight labor market? Did some groups of workers start at a disadvantage and remain behind, even as conditions improved? Were certain groups of workers more responsive to changes in labor demand than others? And where did these groups stand by the end of 2024? Contrasting experiences underscore the importance of looking beyond aggregate trends.This post is part of a broader blog series examining labor market dynamics through the lens of the Beveridge curve. For background on how we employed this approach during the early stages of the pandemic, please refer to these St. Louis Fed On the Economy posts: “What Does the Beveridge Curve Tell Us about the Labor Market Recovery?” (July 14, 2022); “What Is the Key to Improving Worker Resiliency in the Labor Market?” (Aug. 30, 2022); and “The Beveridge Curve and Structural Barriers in the Labor Market” (Oct. 20, 2022).
Starting Points before the Pandemic
Before understanding how individuals experienced the labor market during and after the pandemic, we must consider where they stood before it began. The period from January 2017 to March 2020 offers a useful baseline marked by relative economic stability and low overall unemployment. Yet, beneath those strong headline numbers, not everyone was well positioned.
Some, such as American Indians and Alaska Natives (Native Americans, for the purpose of this post), Black Americans, single mothers and individuals with a disability, entered the pandemic with unemployment rates that were consistently higher than the national average. Others, like Asian Americans and people with higher levels of education, tended to have lower unemployment rates than the national average and stronger labor market attachment. These differences in starting points shaped how people were affected by the pandemic shock and how they recovered in the years that followed.
Understanding these baselines helps us trace the trajectories that followed. Who was already at a disadvantage? Who had a buffer going into the crisis? And how might those initial conditions influence postpandemic outcomes?
Pandemic-Induced Shifts in the Beveridge Curve
As shown by the figure, the COVID-19 pandemic caused a dramatic outward shift in the Beveridge curve, reflecting a sudden and severe disruption in the relationship between job openings and unemployment. However, while the overall labor market experienced a sharp shock followed by a gradual recovery, the magnitude and trajectory of that shift varied significantly across workers.
Two groups that stand out in sharp contrast are Native American workers and Asian American workers.
Native American workers entered the pandemic with one of the highest baseline unemployment rates among all groups. When the pandemic hit, their own Beveridge curveWe calculated separate Beveridge curves for each of the demographic characteristics mentioned in Endnote 1 in each of the periods studied. This was done by running a regression of the individuals’ unemployment status on the logarithm of vacancies, using dummy variables for each period, and the interactions of logarithmic vacancies and the period dummy variables. We use these with values of logarithmic vacancies from 1.4 to 2.0 to predict the various unemployment rates associated with each vacancy. shifted sharply outward, further than those for most other groups. This indicated a severe breakdown in job matching efficiencies and a disproportionate rise in unemployment. Moreover, their curve did not return to its prepandemic position by the end of 2024. This suggests that Native American workers faced not only a deeper initial shock but a slower and more incomplete recovery. Structural barriers, geographic isolation and limited access to remote work likely contributed to this prolonged disadvantage.See Karina Korostelina and Jocelyn Barrett’s 2023 article, “Bridging the Digital Divide for Native American Tribes: Roadblocks to Broadband and Community Resilience,” in Policy & Internet.
In contrast, Asian American workers began the pandemic with one of the lowest unemployment rates and strongest labor market attachments. However, they experienced a sharp and immediate increase in unemployment early in the pandemic, more than what might have been expected given their prepandemic position. This spike has been linked in part to anti-Asian sentiment and discrimination, particularly in customer-facing roles.See Bongki Woo and Kawon Kim’s 2024 article, “Racial Discrimination against Service Employees: The Influence of Managers and Employees’ Responses,” in the Cornell Hospitality Quarterly.
Yet, unlike Native Americans, Asian American workers saw a relatively swift recovery. And they weren’t the only group that recovered by the end of 2024. Others, such as out-of-school young adults with no more than a high school diploma, not only had returned to baseline but had improved, reflecting labor market resilience, a rebound in demand for their skills and an erosion in job search barriers (e.g., inefficiencies with search). Still, some workers had yet to rebound from the pandemic’s shock to the labor market.
Who Has More than Recovered?
While some workers remain on Beveridge curves that denote weaker positions than their prepandemic labor market positions, others have recovered, and their curves represent stronger positions than before the pandemic began.
Lower-income households are one such example. Historically more vulnerable to economic downturns, these workers saw notable gains during the tight labor market of 2022-24. As employers struggled to fill open positions, wage growth accelerated more quickly at the lower end of the income distribution. This shift, combined with increased job availability in the service and logistics sectors, helped boost employment opportunities for many lower-wage workers beyond their prepandemic levels.
Certain racial and ethnic minority groups also experienced meaningful improvements. For instance, workers who are Hispanic or Latino, who faced steep job losses early in the pandemic, saw a strong rebound as demand surged in construction, warehousing and hospitality. By the end of 2024, their chances of unemployment had returned to the baseline. For some groups, their chances not only returned but dipped below the baseline.
Several factors contributed to these improved outcomes. The unusually tight labor market created more opportunities for workers who had previously faced barriers to entry. In some sectors, job requirements were relaxed, and employers became more flexible with scheduling, experience and credentials.See Louise Sheiner, David Wessel and Elijah Asdourian’s 2024 report, “The U.S. Labor Market Post-COVID: What’s Changed, and What Hasn’t?,” for the Hutchins Center on Fiscal and Monetary Policy at the Brookings Institution. Expanding remote and hybrid work opened new doors for some workers who were previously constrained by geography or caregiving responsibilities.See Scott Fulford’s 2023 essay, “Return to Office? How COVID-19 and Remote Work Reshaped the Economy” on the Princeton University Press website.
These gains remind us that tight labor markets can create windows of opportunity, especially for individuals who have been on the margins of the workforce. Tight labor markets can enhance these workers’ ability to participate more effectively in the economy.
Who Has Not Fully Recovered?
While the overall labor market has largely returned to its prepandemic position, not all people have fully benefited from the recovery. Some groups continue to experience unemployment chances that are elevated relative to their baseline levels from 2017 to 2020.
As mentioned earlier, Native American workers stand out as one of the groups furthest from their prepandemic level unemployment rates and Beveridge curves. Despite increased job openings nationwide and overall labor demand improvements, their chances of unemployment remain well above their prepandemic baseline, which was already above the national average. This persistent gap suggests that the labor market recovery has not reached all corners of the workforce equally. Structural barriers—including geographic isolation, limited access to broadband and remote work opportunities—and long-standing disparities in education and health care likely contribute to this continued disadvantage.See Matthew Gregg and Robert Maxim’s 2022 article, “Native Americans Are Getting Left Behind in the Remote Work Economy,” for the Brookings Institution.
These findings highlight that a return to aggregate labor market strength does not guarantee relative improvement in outcomes. For some, the pandemic’s disruption has had lasting effects, and the position of the Beveridge curve remains a reminder of the uneven nature of recovery and the existence of structural barriers and hurdles that can impact people differently.
Conclusion
The pandemic affected workers in a variety of ways. As we’ve seen, people entered the crisis from very different starting points, and those initial conditions shaped how they experienced the labor market over the following years. Some, like Native Americans, faced steep and lasting setbacks, while others, such as lower-income households and Hispanic or Latino workers, improved their labor outcomes relative to those before the pandemic.
These differences in how far people shifted and whether they’ve returned to baseline highlight the uneven nature of recovery. Looking at only aggregate unemployment rates masks the deeper story: Labor market vulnerability varies.
Understanding the distinctiveness of workers’ experiences and outcomes is essential for interpreting where the labor market stands today and anticipating how future downturns might affect different populations. In our next post, we’ll explore another layer of this story: how sensitive individuals are to changes in labor demand. By examining differences in the relative steepness of Beveridge curves, we’ll see who is most responsive to economic shocks, and who is most at risk when conditions deteriorate and then improve.
Notes
- We examined workers by various demographic characteristics: by sex (men and women), by race and ethnicity (white, Black, Hispanic or Latino, Asian, American Indian and Alaska Native, and other or mixed races), by education (high school dropouts, high school graduates, some college and at least a college degree), by geography (principal city, suburban and rural), by recent experience in the labor market (new entrants), by income and by age. We also looked at women with children, people who were born in the U.S., and those who were U.S. citizens regardless of place of birth.
In addition, our analysis included groups with a specific mix of demographics: Black new entrants, Hispanic or Latino new entrants, new entrants living in a principal city with no more than a high school diploma, suburban new entrants with no more than a high school diploma, and rural entrants with no more than a high school diploma. Finally, we also examined out-of-school young people (18- to 24-year-olds who are neither in school nor working) with no more than a high school diploma and people with a disability.
- This post is part of a broader blog series examining labor market dynamics through the lens of the Beveridge curve. For background on how we employed this approach during the early stages of the pandemic, please refer to these St. Louis Fed On the Economy posts: “What Does the Beveridge Curve Tell Us about the Labor Market Recovery?” (July 14, 2022); “What Is the Key to Improving Worker Resiliency in the Labor Market?” (Aug. 30, 2022); and “The Beveridge Curve and Structural Barriers in the Labor Market” (Oct. 20, 2022).
- We calculated separate Beveridge curves for each of the demographic characteristics mentioned in Endnote 1 in each of the periods studied. This was done by running a regression of the individuals’ unemployment status on the logarithm of vacancies, using dummy variables for each period, and the interactions of logarithmic vacancies and the period dummy variables. We use these with values of logarithmic vacancies from 1.4 to 2.0 to predict the various unemployment rates associated with each vacancy.
- See Karina Korostelina and Jocelyn Barrett’s 2023 article, “Bridging the Digital Divide for Native American Tribes: Roadblocks to Broadband and Community Resilience,” in Policy & Internet.
- See Bongki Woo and Kawon Kim’s 2024 article, “Racial Discrimination against Service Employees: The Influence of Managers and Employees’ Responses,” in the Cornell Hospitality Quarterly.
- See Louise Sheiner, David Wessel and Elijah Asdourian’s 2024 report, “The U.S. Labor Market Post-COVID: What’s Changed, and What Hasn’t?,” for the Hutchins Center on Fiscal and Monetary Policy at the Brookings Institution.
- See Scott Fulford’s 2023 essay, “Return to Office? How COVID-19 and Remote Work Reshaped the Economy” on the Princeton University Press website.
- See Matthew Gregg and Robert Maxim’s 2022 article, “Native Americans Are Getting Left Behind in the Remote Work Economy,” for the Brookings Institution.


Citation
William M. Rodgers III and Alice L. Kassens, ldquoHow Have U.S. Workers Fared in a Labor Market Reshaped by the Pandemic?,rdquo St. Louis Fed On the Economy, Aug. 19, 2025.
This blog offers commentary, analysis and data from our economists and experts. Views expressed are not necessarily those of the St. Louis Fed or Federal Reserve System.
Email Us
All other blog-related questions