


What Is the Key to Improving Worker Resiliency in the Labor Market?
In a blog post last month, our analysis of the Beveridge curve revealed how the COVID-19 public health crisis, relief and recovery assistance, the Great Resignation and other structural factors changed the job matching process between employers and candidates. Basically, employers face increased difficulties attracting workers.
The pandemic shifted the Beveridge curve—which represents the relationship between the unemployment rate and the job openings rate—outward with the rapid increase in unemployment, followed by increasing job vacancies even as the unemployment rate returned to pre-pandemic levels.
Today’s blog post shows that the predicted Beveridge curve for the overall labor market nearly returned to its pre-pandemic level, which was a strong labor market. More important, this is a positive development since it indicates that, even after controlling for personal, household and geographic characteristics, job matches are happening faster, acting to lower unemployment.
Surprisingly, the Beveridge curves of many vulnerable groupsTo see how the Institute defines vulnerable groups, see William Rodgers III’s October 2021 blog post, “Monitoring the Recovery of Vulnerable Workers and Their Families.” who faced structural barriers to participation prior to the pandemic (e.g., noncollege-educated people, people of color, and young adults living in core urban areas and not enrolled in school) have also returned closer to their pre-pandemic positions. Women with children are the exception: Their Beveridge curve has not returned to its pre-pandemic position.
Potential Pathways for the Labor Market
The pressing question now is how will these vulnerable groups fare amid weaker economic activity. As the Federal Reserve steadily raises interest rates to bring inflation back to 2%, there is much discussion about whether the U.S. economy is currently in or approaching a recession.
Applying the “rule of thumb”— an economy is in recession when gross domestic product (GDP) falls in two consecutive quarters—could lead to that conclusion. However, the National Bureau of Economic Research’s definition of a recession is based on a variety of macro indicators. To date, they have not designated the first two quarters of 2022 as recessionary. Many key economic indicators show signs of slowing but remain quite strong.
Though lowering inflation will improve the economy’s health and stability in the long run, the job prospects of these vulnerable groups are more sensitive to slower macroeconomic growth and downturns. A key to helping workers become more resilient to changes in the labor market hinges on removing the structural barriers that reduce the efficiency of the job matching process.
Given the uncertainty surrounding the economy, what are the possible paths for the labor market? One potential pathway is that the overall unemployment rate will not increase substantially as the job openings rate falls. Under this scenario, the number of job openings could fall from its extremely high level over the next few months to a lower (but still strong) level and have a relatively limited effect on hiring and unemployment.
Another possible pathway is finding ways to ensure that a decline in the vacancy rate does not lead to a substantial increase in the unemployment rate. How? There would have to be a considerable improvement in the job matching process. The rigidities or structural barriers to work that existed prior to the pandemic or emerged as a result of the pandemic need to be reduced. Such barriers include inadequate child care for working mothers, weak job search networks, poor transportation and discrimination.
This blog identifies the groups that need assistance with improving their job matching efficiencies. Providing such assistance could help vulnerable workers stay attached to the labor market if conditions deteriorate.
Requirements for a More Resilient Labor Force
Based on our analysis, a more resilient labor force depends on whether the Beveridge curves of workers viewed as “marginal” or “vulnerable” shift to their pre-pandemic positions: fewer job openings while maintaining low unemployment. The following two figures show that the Beveridge curve for the overall labor market from July 2021 to May 2022 (the dashed curve) is virtually at its pre-pandemic position (the dotted curve).The difference between the pre-April 2020 (dotted) and July 2021-May 2022 (dashed) curves in the unadjusted figure ranges from 0.9 to 1.2 percentage points. The difference between the adjusted Beveridge curves for these same periods ranges from 0.3 to 0.6 percentage points.
Beveridge Curve for U.S. Labor Market: Unadjusted Employment Model
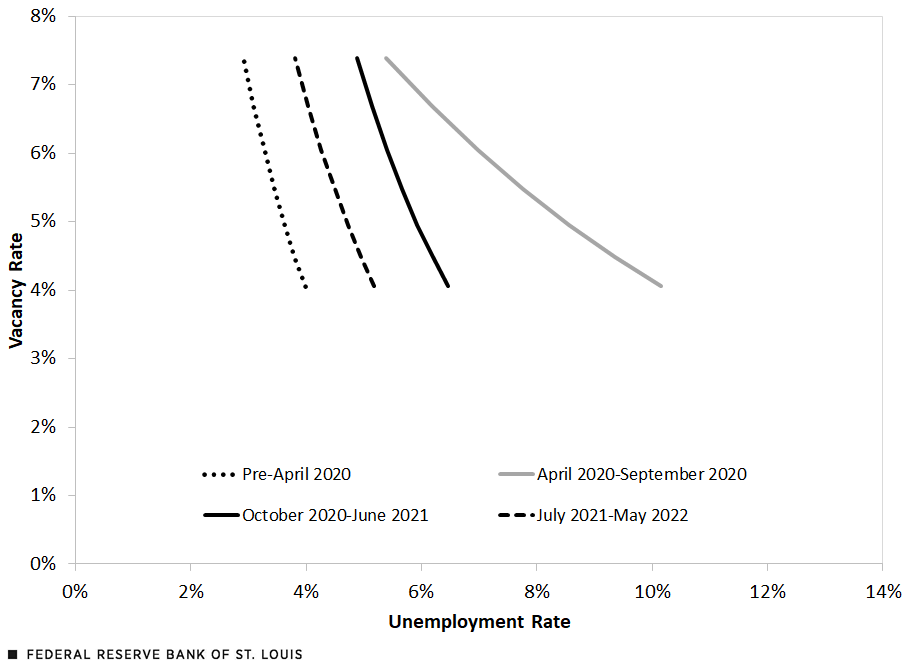
SOURCES: Current Population Survey; Job Opening and Labor Turnover Survey (JOLTS); and authors’ calculations
NOTE: Unadjusted Beveridge curves are constructed from coefficients that come from authors' regression of a dummy variable indicating whether the individual is unemployed, plus a state’s vacancy rate, dummy variables for period, and the period interactions with a state’s vacancy rate.
Beveridge Curve for U.S. Labor Market: Adjusted Employment Model
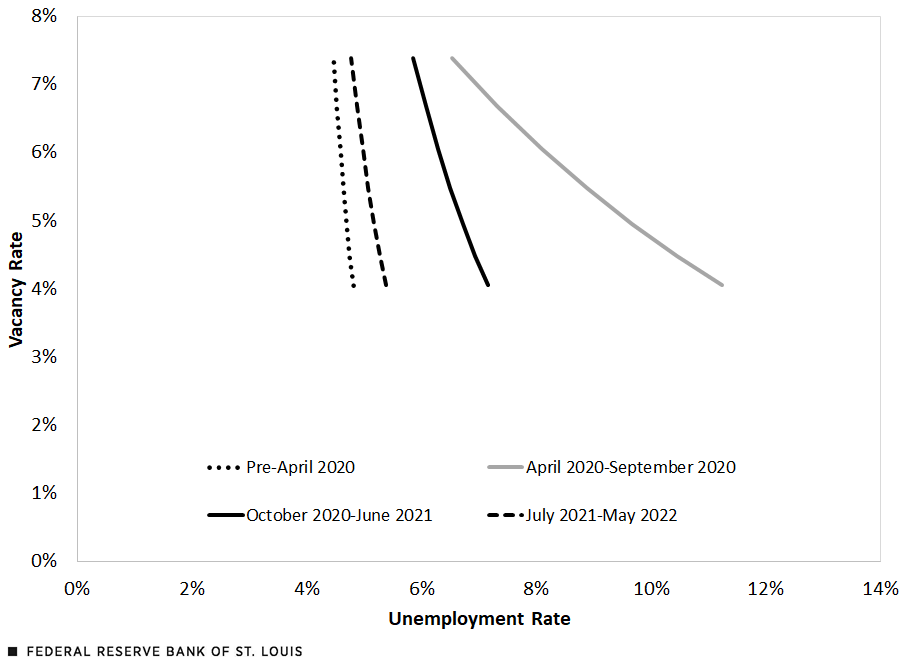
SOURCES: Current Population Survey; Job Opening and Labor Turnover Survey (JOLTS); and authors’ calculations.
NOTE: The adjusted Beveridge curves are constructed from coefficients that come from the unadjusted curves but include controls for educational attainment, potential work experience, race and ethnicity, gender, state of residence, family income and marital status.
Breaking Down the Curve for Vulnerable Workers
The good news is that the regression-adjusted curves of young adults; noncollege-educated adults; and young noncollege-educated adults from core urban, suburban and rural areas have returned to their pre-pandemic Beveridge curves. This position could change because they have the greatest sensitivity to changes in job openings. The Institute will be monitoring their unemployment rates over the next few months.
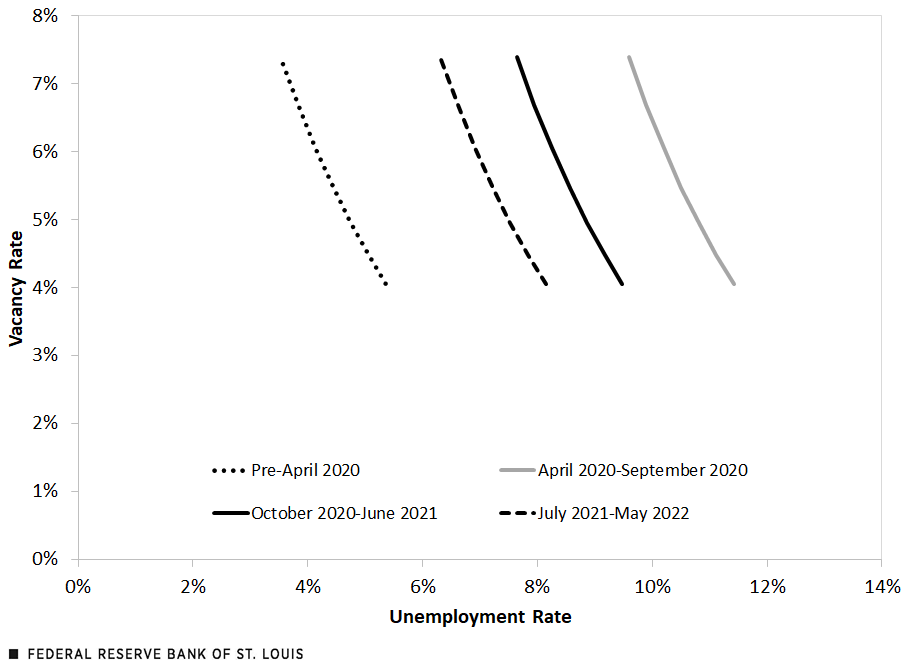
However, the Beveridge curves of white, Black and Latina women have not fully returned to their pre-pandemic positions. Single mothers are particularly exposed to structural issues, as shown in the two figures below. For example, even as state mandates lifted and children returned to school, an exposure could send the child back home. The uncertainty associated with the quarantine requirement poses a challenge to single mothers with few resources to watch the child while they are at work. Along with the vulnerable groups listed above, the labor market experiences of these women over the next few months are critical to how buoyant the overall labor market can remain.
Beveridge Curve for Single Mothers: Adjusted Employment Model
Beveridge Curve for Single Mothers with School-Age Children: Adjusted Employment Model
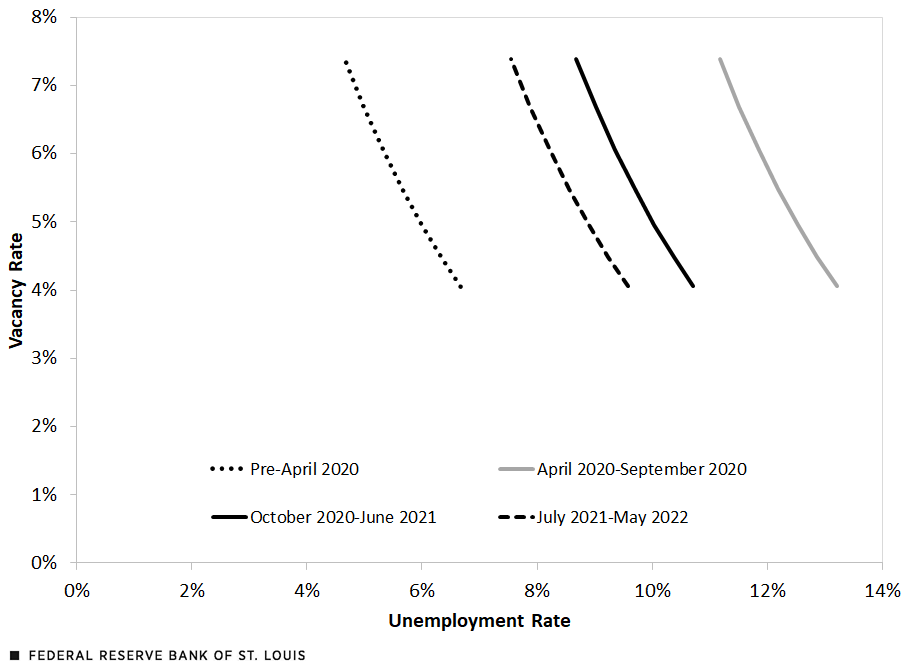
SOURCES FOR THE TWO FIGURES: Current Population Survey; Job Opening and Labor Turnover Survey (JOLTS); and authors’ calculations.
NOTE FOR THE TWO FIGURES: The adjusted Beveridge curves are constructed from the authors' regression of a dummy variable indicating whether the individual is unemployed, plus a state’s vacancy rate, dummy variables for period, and the period’s interactions with a state’s vacancy rate, as well as controls for educational attainment, potential work experience, race and ethnicity, state of residence, family income and marital status.
Why do the Beveridge curves of women, particularly single mothers, remain above their pre-pandemic levels? As we showed in our earlier blog post about the Beveridge curve, the pandemic and government responses created structural challenges that reduced job search efficiency and the hiring process, and disparately so. Some of these inefficiencies remain.
People are still concerned about contracting COVID-19 in the workplace, and children are still being sent home due to exposure, needing a parent to care for them at unpredictable times. Mental health deteriorated over the pandemic, and disparately across groups, which can serve as a barrier to getting and keeping a job.
Further, many structural barriers existed before the pandemic, including weaker skills, lack of access to affordable, good-quality child care, transportation problems, incarceration, addiction and discrimination. Individually and collectively, they reduce job matching efficiency.
For these people and their families, the key to enduring a weaker labor market will hinge more on efforts to reduce barriers to their searching, finding, receiving and accepting job offers than on personal characteristics like education and work experience.
The Economy Is at a Fork in the Road
To date, the labor market is holding up. Job openings peaked in March 2022 at 11.9 million, falling to 11.2 million in July, corresponding to vacancy rates of 7.3 percent to 6.9 percent, respectively, which are far higher than the 4.4% rate in February 2020. Further, even though the vacancy rate has been easing, the unemployment rates of vulnerable groups have not begun to increase. Nor have their employment-population ratios begun to fall.
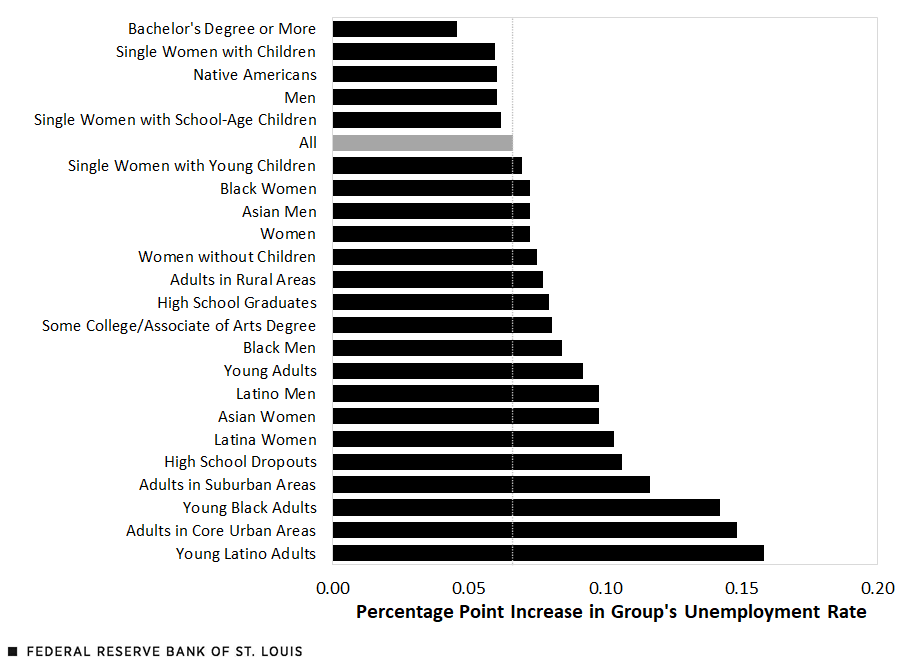
This may not last for long. The following figure shows estimates of the impact that a 1 percentage point decrease in the vacancy rate has on the unemployment rates of all workers and these vulnerable groups. They indicate that since 2000, the unemployment rates of these groups are more sensitive to changes in job openings.
The Impact of a 1 Percentage Point Decline in the Vacancy Rate on the Probability of Increased Unemployment
SOURCES: Current Population Survey; Job Opening and Labor Turnover Survey (JOLTS); and authors’ calculations.
Thus, if the slowdown in job openings accelerates and little is done to reduce job matching efficiencies (e.g., skills, access to child care, discrimination, transportation), the risk of a “hard” landing increases, with these groups bearing the brunt of it.
However, if the U.S. has already entered a recession (under the “rule of thumb” definition) and the economic slowdown intensifies, then labor market conditions would deteriorate, with vulnerable groups experiencing a more severe erosion in their employment. Automatic stabilizers such as the unemployment insurance system would have to be used to cushion the blow.
Simply put, to lessen the impact, will proactive assistance (e.g., improving access to child care, improving job information, or providing counseling to those with anxiety and depression) or reactive support (e.g., unemployment insurance benefits) be given to vulnerable people, their families and communities?
In our next blog post, the labor market experiences of vulnerable groups will be detailed. The goal will be to use the Beveridge curve to help readers understand that parental, racial, ethnic, gender, age, educational attainment and geographic differences in unemployment rates are largely structural and that these differences have less to do with personal characteristics such as educational attainment and labor market experience. Even the recent extremely tight labor market has been unable to erode the differences.
Notes
1 To see how the Institute defines vulnerable groups, see William Rodgers III’s October 2021 blog post, “Monitoring the Recovery of Vulnerable Workers and Their Families.”
2 The difference between the pre-April 2020 (dotted) and July 2021-May 2022 (dashed) curves in the unadjusted figure ranges from 0.9 to 1.2 percentage points. The difference between the adjusted Beveridge curves for these same periods ranges from 0.3 to 0.6 percentage points.


Citation
William M. Rodgers III and Alice L. Kassens, ldquoWhat Is the Key to Improving Worker Resiliency in the Labor Market?,rdquo St. Louis Fed On the Economy, Aug. 30, 2022.
This blog offers commentary, analysis and data from our economists and experts. Views expressed are not necessarily those of the St. Louis Fed or Federal Reserve System.
Email Us
All other blog-related questions