


The Beveridge Curve and Structural Barriers in the Labor Market
A previous blog post in this seriesThe first blog post in this series, “What Does the Beveridge Curve Tell Us about the Labor Market Recovery?” was published in July 2022 and the second, “What Is the Key to Improving Worker Resiliency in the Labor Market?” was published in August 2022. showed that although the Beveridge curvesThe Beveridge curve represents the relationship between the unemployment rate and the job openings, or vacancy, rate. of some vulnerable groupsTo see how the St. Louis Fed’s Institute for Economic Equity defines vulnerable groups, read William Rodgers III’s October 2021 blog post, “Monitoring the Recovery of Vulnerable Workers and Their Families.” who faced structural barriers to labor force participation before the COVID-19 pandemic have shifted back toward their pre-pandemic positions, others have not. These include the Beveridge curves for young adults, Black men, Latino men, Black young adults, people with no more than a high school diploma, nonenrolled young adults, women with children, and people with a disability.
Yet a return to pre-pandemic levels understates the challenges that these particular groups face in the labor market. For these and other vulnerable groups, their curves in February 2020 were already higher than the curve for the entire adult population.
Today, by utilizing monthly Current Population Survey data from July 2021 to July 2022 and a Beveridge curve framework, we show that these groups have different Beveridge curves compared with the overall workforce, meaning structural impediments to the job matching process reduce their success. Despite the extremely “tight” U.S. labor market, structural challenges remain and create inefficiencies in the job matching process.
A well-developed literature seeks to explain why a large portion of the unemployment among vulnerable groups is structural. In particular, a growing body of research shows how a lack of access to affordable child care reduces job matching efficiency for mothers.
The Background: Structural Barriers and the Job Matching Process
There is little debate about the following: The unemployment rate for Black workers typically is about twice the unemployment rate for white workers, regardless of point in the business cycle. Young adults who are not enrolled in school and have no more than a high school diploma have persistently high unemployment rates, especially among those who are Black or Latino. People with a disability also have persistently high unemployment rates.
There is less agreement about whether personal characteristics or structural impediments drive this lower participation. Characteristics cited for inhibiting labor participation include a lack of education, skills, job networks and information. Common structural barriers are child care, employer and societal attitudes regarding race, ethnicity, gender and age, as well as one’s mental health, ex-offender and disability status. All of these reduce job matching efficiency.
The pandemic called attention to the persistent challenges that vulnerable workers, especially mothers, face in participating in the labor market, and it highlighted the role that structural barriers play in the job matching process.
Mothers, particularly single mothers, confront persistent barriers to labor force participation. One study found that between February 2020 and August 2021, caregiving duties accounted for about 75% of the decline in the labor force participation rate of mothers with school-age children. Nonparticipation for Black and Latina mothers was significantly higher than for white mothers through the first half of 2021, potentially due to a concentration of virtual education in predominantly Black or Latino school districts. Single mothers experienced a greater drop in employment than other parents, and they bore a greater share of the COVID-19-era child care obligations, including remote learning and day care.
Instead of employing the typical regression-based approach to identify the relative contributions of these factors, the next section describes our results using the Beveridge curve model.
What about the Beveridge Curves?
We previously demonstrated that structural features explain shifts in the Beveridge curve. In other words, differences in Beveridge curves over time are due to structural factors.
We applied this logic to demographic groups, but at a point in time. Different Beveridge curves between groups are due to structural factors. For example, the difficulty with obtaining child care is a key structural reason that mothers have higher unemployment rates than other people at the same job openings rate.
It is reasonable to think that structural barriers erode during tight labor markets. Employers’ need for workers offsets the costs of the impediments. Increased compensation raises the costs of remaining unemployed or out of the labor force. The period from July 2021 to July 2022 provides an excellent opportunity to assess this assertion because it is a period of record labor market tightness.
The figure below shows the predicted Beveridge curves for all adults (gray), single mothers (green) and single mothers with school-age children (dotted green).
Single Mothers Have Higher Beveridge Curves than the Adult Population as a Whole
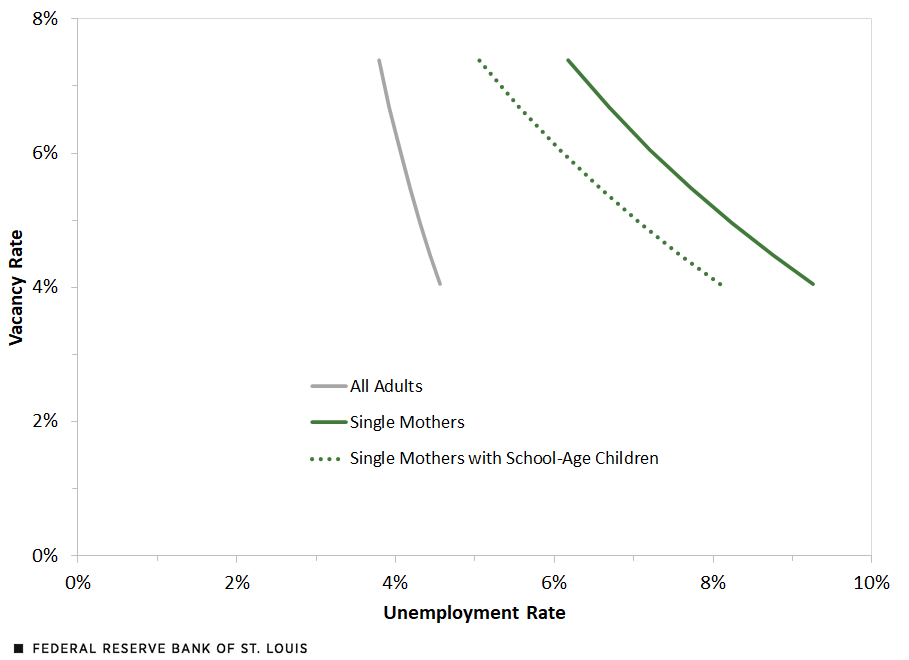
SOURCES: Current Population Survey; Job Opening and Labor Turnover Survey (JOLTS); and authors’ calculations.
NOTES: Figure data is from July 2021 to July 2022. Unadjusted Beveridge curves are constructed from coefficients that come from authors' regression of a dummy variable indicating whether the individual is unemployed, plus a state’s vacancy rate, dummy variables for period, and the period interactions with a state’s vacancy rate.
At a given vacancy rate on the unadjusted Beveridge curves, the unemployment rates for single mothers and single mothers with school-age children exceed the unemployment rate for all adults. Some structural differences could have existed before the pandemic. And although most schools returned to in-person learning in the fall of 2021, the uncertainty of exposure to COVID-19 and the associated quarantine rules may still have presented a challenge for single mothers of school-age children.
Not all jobs provide the flexibility to stay at home for an extended period to care for a child required to isolate or quarantine, particularly when it is unpredictable. Such child care issues are a structural barrier to mothers. The Centers for Disease Control and Prevention recently changed its test-to-stay guidance and relaxed quarantine recommendations for students, which should help break down this barrier starting in the fall of 2022. The question is whether structural impediments recede or become permanent.
The figure below shows the predicted Beveridge curves for several vulnerable groups during our period of focus, July 2021 to July 2022. Black men and Black women in particular face structural barriers, with their Beveridge curves considerably higher than the general adult population. This evidence is more consistent with research emphasizing the role that structural hurdles play in explaining inefficiencies in the job matching process and, thus, the higher unemployment rates faced by these groups.
The Beveridge curve for people with a disabilityThe Current Population Survey includes several questions pertaining to disabilities, including questions about difficulty seeing, hearing, walking/climbing stairs, bathing and concentrating. is upward sloping, indicating that vacancies and unemployment move in the same direction. A reason for the positive predicted relationship may be that increasing vacancies are for jobs that aren’t a match for people with a disability, prolonging their job searches and increasing their unemployment rate.
Vulnerable Groups Generally Have Higher Beveridge Curves than the Adult Population as a Whole
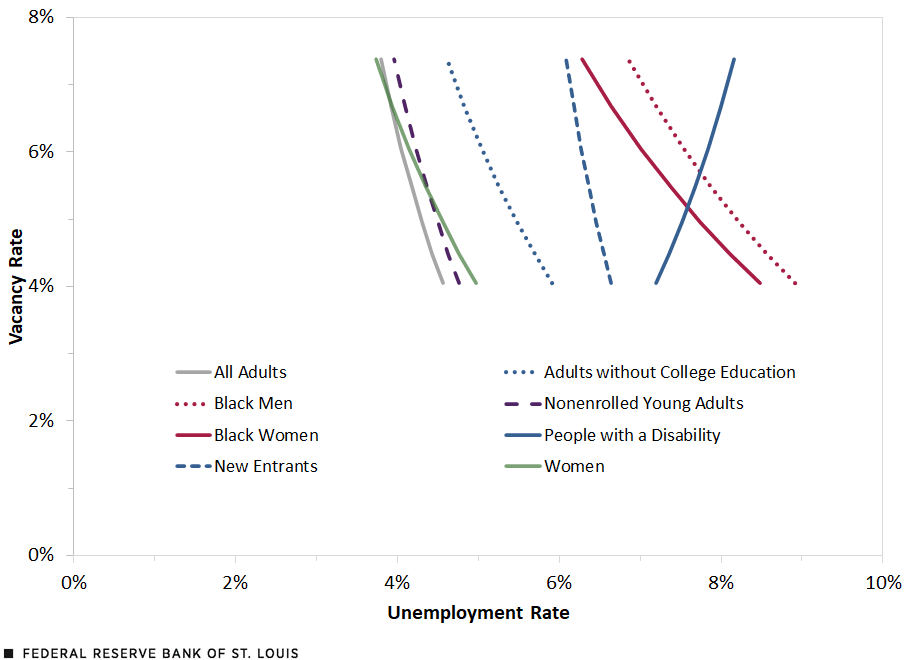
SOURCES: Current Population Survey; Job Opening and Labor Turnover Survey (JOLTS); and authors’ calculations.
NOTES: Figure data is from July 2021 to July 2022. Unadjusted Beveridge curves are constructed from coefficients that come from authors' regression of a dummy variable indicating whether the individual is unemployed, plus a state’s vacancy rate, dummy variables for period, and the period interactions with a state’s vacancy rate.
More about Structural Barriers, Less about Personal Characteristics
Our analysis suggests that the weaker labor market outcomes of mothers, women, Black men, noncollege-educated adults, nonenrolled young adults, and people with a disability are due to structural barriers to the job matching process. Even after controlling for personal characteristics like educational attainment and age, the Beveridge curves of these groups indicate that their higher unemployment rates have less to do with such characteristics and more to do with structural impediments, for example, access to child care, transportation, and job information and networks, employer and societal attitudes concerning race, ethnicity, gender and age, and also mental health, ex-offender and disability status.
The dual Beveridge curve may be another potential barrier. If most job vacancies are filled through a matching process geared for job-to-job transitions, those looking to move from unemployment to employment face the added challenge of inaccessible jobs.
Notes
- The first blog post in this series, “What Does the Beveridge Curve Tell Us about the Labor Market Recovery?” was published in July 2022 and the second, “What Is the Key to Improving Worker Resiliency in the Labor Market?” was published in August 2022.
- The Beveridge curve represents the relationship between the unemployment rate and the job openings, or vacancy, rate.
- To see how the St. Louis Fed’s Institute for Economic Equity defines vulnerable groups, read William Rodgers III’s October 2021 blog post, “Monitoring the Recovery of Vulnerable Workers and Their Families.”
- The Current Population Survey includes several questions pertaining to disabilities, including questions about difficulty seeing, hearing, walking/climbing stairs, bathing and concentrating.


Citation
William M. Rodgers III and Alice L. Kassens, ldquoThe Beveridge Curve and Structural Barriers in the Labor Market,rdquo St. Louis Fed On the Economy, Oct. 20, 2022.
This blog offers commentary, analysis and data from our economists and experts. Views expressed are not necessarily those of the St. Louis Fed or Federal Reserve System.
Email Us
All other blog-related questions