

The State of U.S. Wealth Inequality
The State of U.S. Wealth InequalityThe State of U.S. Wealth Inequality replaces the Real State of Family Wealth, a product launched in 2020. presents a timely look at average, inflation-adjusted wealth for various demographic groups. The Institute for Economic Equity provides quarterly data on racial, generational and educational wealth inequality based on average U.S. household wealth.Average wealth estimates are much higher than median wealth estimates and therefore are more representative of wealthier families’ experiences. However, median (i.e., the middle of the distribution) data on household wealth aren’t available on a quarterly basis. See our latest data on median wealth gaps by demographic group. Knowing the current state of wealth inequality sheds light on opportunities to foster a more equitable economy where everyone can thrive.
These estimates reveal the size of the wealth gaps between different demographic groups and identify which groups have the fewest resources. Knowing the magnitude of these gaps over time is an important step toward understanding why these differences persist and what actions might close them. Expanding the opportunity to build wealth to all families creates the potential for greater economic equity.
Key Takeaways
For the third quarter of 2023 (through Sept. 30):
How much wealth inequality is there in the U.S.?
- The top 10% of households by wealth had $6.5 million on average. As a group, they held 66.6% of total household wealth.
- The bottom 50% of households by wealth had $50,000 on average. As a group, they held only 2.6% of total household wealth.
What is the current generational wealth gap?
- Younger Americans (millennials and Gen Zers) owned $1.33 for every $1 of wealth owned by Gen Xers at the same age.Wealth holdings of younger Americans are for households headed by someone born in 1981 or later. This group comprises households from two generations: millennials and Gen Zers. In future releases, wealth holdings will be broken out for each of these generations once the underlying data allow us to do so. Returning readers may notice that our previous quarterly estimates of average wealth for younger Americans were lower than wealth estimates for older generations. A new Survey of Consumer Finances data release resulted in significant backward revisions in the Distributional Financial Accounts (DFAs), and updated estimates of the wealth levels of younger Americans were significantly higher than prior estimates. See the methodology section for greater details regarding the DFAs.
- Younger Americans (millennials and Gen Zers) owned $1.21 for every $1 of wealth owned by baby boomers at the same age.
What is the current racial wealth gap?
- Black families owned about 24 cents for every $1 of white family wealth, on average.
- Hispanic families owned about 19 cents for every $1 of white family wealth, on average.
What is the current wealth gap by household education?
- Families headed by someone with some college education (but no four-year degree) had 31 cents for every $1 of wealth held by families headed by a four-year college graduate.
- Families headed by someone with a high school diploma had 22 cents for every $1 of wealth held by families headed by a four-year college graduate.
- Families headed by someone with less than a high school diploma had 9 cents for every $1 of wealth held by families headed by a four-year college graduate.
Despite increased volatility, average wealth grew for all groups over the past four years (including during the COVID-19 pandemic). Wealth gains partially eroded starting in 2022 as economic headwinds (e.g., inflation, expiration of pandemic-related support) put pressure on household finances. That said, average wealth outcomes remain elevated relative to pre-pandemic levels as of the third quarter of 2023.
To visualize these data in detail, click on the headings below.
We invite you to stay informed by bookmarking this page, The State of U.S. Wealth Inequality, and by signing up for updates.
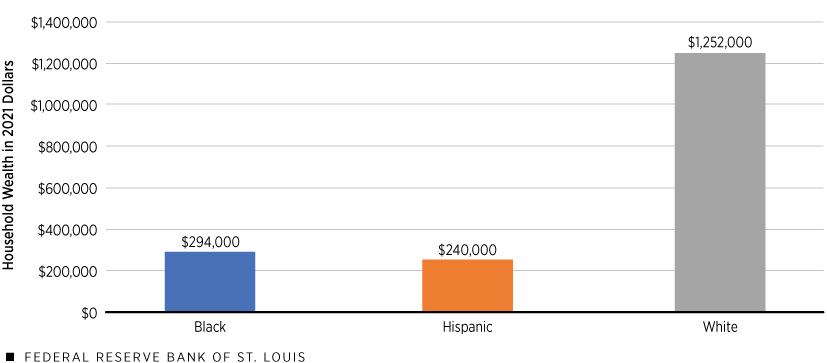
Figures and data show average wealth for Black, Hispanic and white households.
Average Wealth by Primary Race or Ethnicity, Third Quarter of 2023
SOURCES: Distributional Financial Accounts and Institute for Economic Equity calculations.
NOTE: Values have been rounded to the nearest $1,000.
This bar chart shows the average inflation-adjusted wealth for Black, Hispanic and white households in the third quarter of 2023. Black families had about $958,000 less wealth, on average, compared with white families, while Hispanic families had about $1,011,000 less wealth, on average, than white families. In other words, Black families had 24 cents for every $1 of white family wealth, while Hispanic families had 19 cents for every $1. Racial and ethnic wealth gaps have changed very little over the past few decades.
Distribution of U.S. Households and Wealth by Primary Race or Ethnicity, Third Quarter of 2023
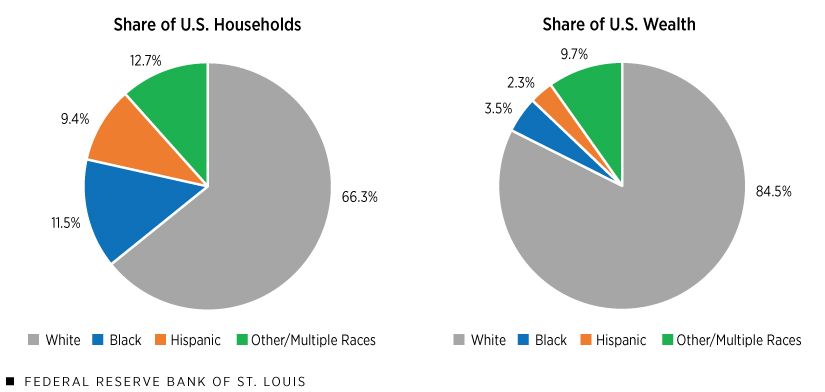
SOURCES: Distributional Financial Accounts and Institute for Economic Equity calculations.
NOTE: Racial and ethnic groups are mutually exclusive; they are based on the primary race or ethnicity of the survey respondent.
White households continue to own a disproportionately greater share of total family wealth. Though they represented 66.3% of households, white households owned 84.5% of total family wealth in the third quarter of 2023; this is 27% more wealth than their representation in the U.S. might predict. In contrast, Black families accounted for 11.5% of households and owned 3.5% of total family wealth (70% less wealth given their household share), while Hispanic families represented 9.4% of households and owned 2.3% of total family wealth (76% less wealth).The Federal Reserve Board’s Distributional Financial Accounts groups households based on the primary race/ethnicity of the survey respondent. Groups in the public dataset are mutually exclusive. The question on race includes white, Black/African American, and Hispanic/Latino as options. In the public dataset, the remainder of respondents are grouped into a diverse “other or multiple races” group, which includes Asians, American Indians, Alaska Natives, Native Hawaiians, Pacific Islanders, other races and multiple racial identifications. Because the diversity of this category of other or multiple races potentially masks great intragroup wealth variation, it is not a focus in The State of U.S. Wealth Inequality.
Cumulative Changes in Average Wealth by Race and Ethnicity
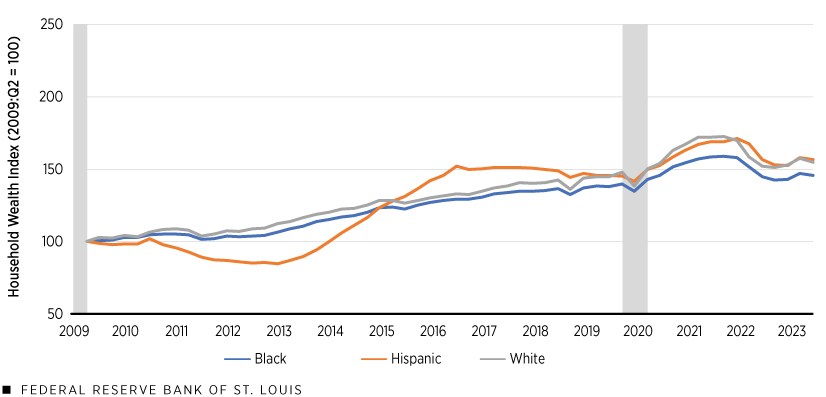
SOURCES: Distributional Financial Accounts and Institute for Economic Equity calculations.
NOTES: Vertical bars indicate recessions. Wealth was inflation-adjusted to 2021 dollars.
Since the end of the Great Recession in 2009, white and Black wealth have followed similar growth trends, on average. Hispanic wealth, however, fell for several years before recovering rapidly. Despite large declines over the course of 2022, average wealth for all groups was higher in 2023 than it was when the pandemic began. However, while the relative gains were the greatest among Hispanic families, the absolute gains fell short of those for white families given the underlying racial wealth gap (shown in earlier figures). For all groups, some of the wealth gains have eroded in the past couple of years as economic headwinds (e.g., inflation, expiration of pandemic-related support) put pressure on household finances. Overall, white average wealth grew 55%, from $809,000 to $1,252,000, since the end of the Great Recession, Black wealth grew 45%, from $202,000 to $294,000, and Hispanic average wealth grew 57%, from $153,000 to $240,000.
Figures and data show average household wealth by generation: baby boomers, Gen Xers and millennials/Gen Zers.
Average Wealth at Ages 33-34 by Generation
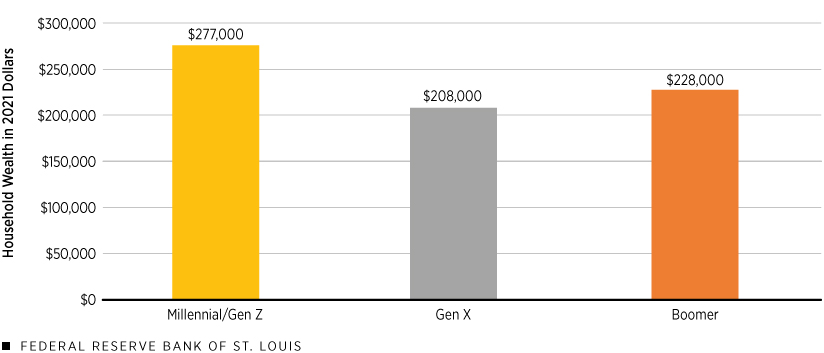
SOURCES: Distributional Financial Accounts and Institute for Economic Equity calculations.
NOTES: Rounded to the nearest $1,000, the values are calculated when each generation was relatively young. The data are based on the quarter and year when the generation’s average age was either 33 or 34: baby boomers, 1989:Q3 (age 34); Gen Xers, 2005:Q3 (age 33); and millennials/Gen Zers, 2023:Q3 (age 33).
Younger Americans (millennials and Gen Zers, or those born in 1981 or later) had greater family wealth, on average, than Gen Xers (born between 1965 and 1980) and baby boomers (born between 1946 and 1964) did when both generations were close to the same average age (33-34).See Endnote 3 for why this estimate of younger American wealth is now significantly higher than previous estimates. In the third quarter of 2023, younger Americans owned $1.33 for every $1 of wealth owned by Gen Xers, on average, at the same age (2005:Q3). Younger Americans owned $1.21 for every $1 of wealth owned by baby boomers, on average, at close to the same age (1989:Q3).
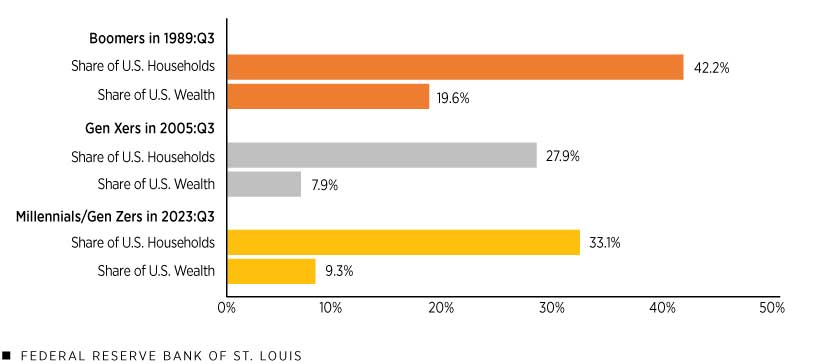
Generational Shares of U.S. Households and Wealth at Same Age
SOURCES: Distributional Financial Accounts and Institute for Economic Equity calculations.
NOTES: Shares are calculated when each generation was relatively young (at an average age between 33 and 34). The data are for the quarter in the year when the generation was at that average age.
When households are younger, they tend to have lower levels of wealth. To address this issue, we compared household and wealth shares across generations when their members were relatively young (at an average age between 33 and 34).
Each generational group owned less wealth than their share of the household population. Baby boomers represented 42.2% of households in the third quarter of 1989, yet they owned only 19.6% of total family wealth in 1989; this is 54% less wealth than their representation in the U.S. might predict. Gen X families accounted for 27.9% of households and owned 7.9% of total family wealth (72% less wealth given their household share) in 2005. Younger American (millennial and Gen Z) families represented 33.1% of households and owned 9.3% of total family wealth (72% less wealth) in 2023. The baby boomers’ shortfall was the smallest of the generations.
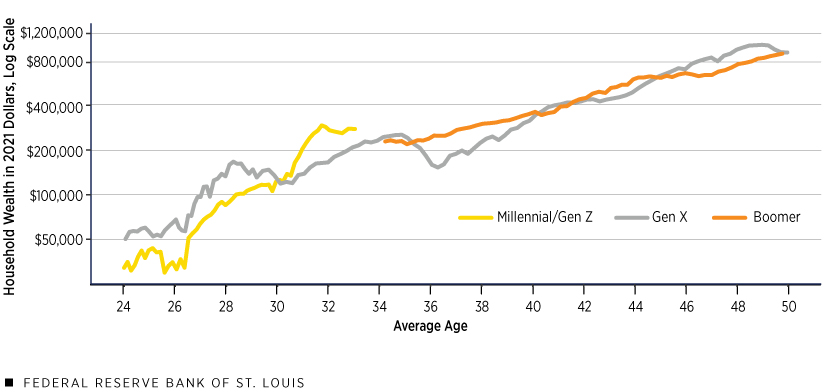
Average Wealth by Generation
SOURCES: Distributional Financial Accounts and Institute for Economic Equity calculations.
This figure shows average, inflation-adjusted family wealth of three different generations during their young- to mid-adult years. Values are centered on the average age of the generation, based on the age of the reference person within households. For example, the average age of younger Americans (millennials and Gen Zers) in the third quarter of 2023 was 33, and Gen Xers had an average age of 33 in the third quarter of 2005.
While trailing Gen Xers for the beginning of their adult lives, younger American families’ average wealth began to exceed that of Gen Xers at around age 30, reflecting historically high wealth levels following the COVID-19 pandemic.
Between ages 34 and 50, the average wealth of Gen Xers and boomers has crossed various times, which is also indicative of larger macroeconomic forces. For example, in 2006 Gen Xers’ average wealth was higher than that of boomers in 1989, but it fell sharply during the Great Recession and took years to recover.
Figures and data show average household wealth by level of completed education: no high school diploma, high school diploma, some college, and at least a four-year college degree.
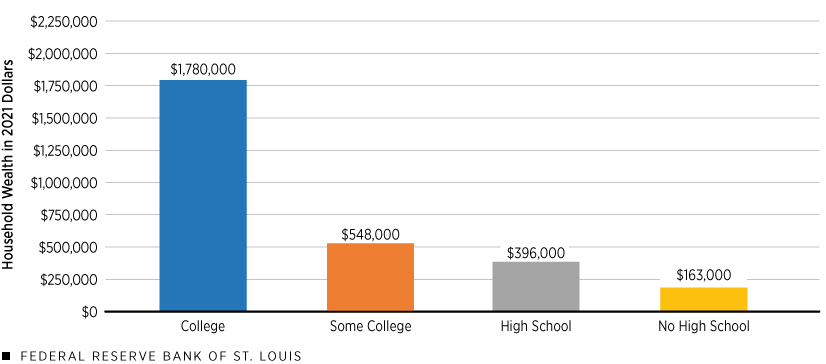
Average Wealth by Education, Third Quarter of 2023
SOURCES: Distributional Financial Accounts and Institute for Economic Equity calculations.
NOTES: Values have been rounded to the nearest $1,000. College represents families with at least a bachelor’s degree; other education levels represent the families’ highest completed education.
This figure shows the average inflation-adjusted wealth for families by education level in the third quarter of 2023. Families headed by someone with some college education (but no four-year degree) had 31 cents in wealth for every $1 held by families headed by a college graduate. Those with a high school diploma owned 22 cents for every $1 of college-graduate wealth, and those with less than a high school diploma had 9 cents for every $1.
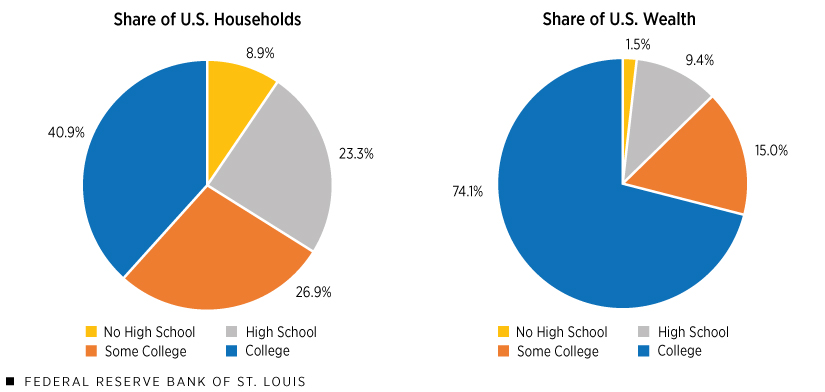
Distribution of U.S. Households and Wealth by Education, Third Quarter of 2023
SOURCES: Distributional Financial Accounts and Institute for Economic Equity calculations.
NOTE: College represents families with at least a bachelor’s degree; other education levels represent the families’ highest completed education.
In the third quarter of 2023, households headed by a college graduate owned the disproportionately highest share of total family wealth. They owned 74.1% of total family wealth despite making up only 40.9% of households, an advantage of 81% greater wealth than we might expect based on their household representation. Families headed by someone with some college education but no degree, those with at most a high school diploma, and those with less than a high school diploma collectively owned 44%, 60% and 83% less wealth, respectively, than we might expect based on their household representation.
Cumulative Changes in Average Wealth by Education
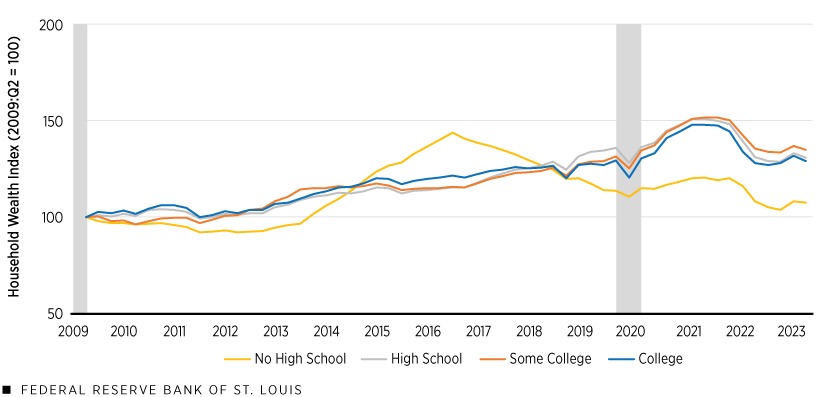
SOURCES: Distributional Financial Accounts and Institute for Economic Equity calculations.
NOTES: College represents families with at least a bachelor’s degree; other education levels represent the families’ highest completed education. Vertical bars indicate recessions. Wealth was inflation-adjusted to 2021 dollars.
This figure shows the average inflation-adjusted wealth of families with a given educational attainment. On average, all families have greater wealth than similarly educated families did after the Great Recession ended. In the third quarter of 2023, the wealth of families with a college degree was 29% greater on average than similar families in 2009 (increasing from $1,380,000 to $1,780,000). In contrast, families with some college had 35% more wealth (increasing from $406,000 to $548,000), and those with just a high school diploma had 31% more than similar families had in 2009 (increasing from $303,000 to $396,000). The least educated group, those without a high school diploma, had 7% more than they had in 2009 (increasing from $151,000 to $163,000). The disparity in dollar values of those gains reflect the underlying educational wealth gap, a gap that has expanded considerably over the past few decades.
- The State of U.S. Wealth Inequality replaces the Real State of Family Wealth, a product launched in 2020.
- Average wealth estimates are much higher than median wealth estimates and therefore are more representative of wealthier families’ experiences. However, median (i.e., the middle of the distribution) data on household wealth aren’t available on a quarterly basis. See our latest data on median wealth gaps by demographic group.
- Wealth holdings of younger Americans are for households headed by someone born in 1981 or later. This group comprises households from two generations: millennials and Gen Zers. In future releases, wealth holdings will be broken out for each of these generations once the underlying data allow us to do so. Returning readers may notice that our previous quarterly estimates of average wealth for younger Americans were lower than wealth estimates for older generations. A new Survey of Consumer Finances data release resulted in significant backward revisions in the Distributional Financial Accounts (DFAs), and updated estimates of the wealth levels of younger Americans were significantly higher than prior estimates. See the methodology section for greater details regarding the DFAs.
- The Federal Reserve Board’s Distributional Financial Accounts groups households based on the primary race/ethnicity of the survey respondent. Groups in the public dataset are mutually exclusive. The question on race includes white, Black/African American and Hispanic/Latino as options. In the public dataset, the remainder of respondents are grouped into a diverse “other or multiple races” group, which includes Asians, American Indians, Alaska Natives, Native Hawaiians, Pacific Islanders, other races and multiple racial identifications. Because the diversity of this category of other or multiple races potentially masks great intragroup wealth variation, it is not a focus in The State of U.S. Wealth Inequality.
- See Endnote 3 for why this estimate of younger American wealth is now significantly higher than previous estimates.
The State of U.S. Wealth Inequality is produced by the Institute for Economic Equity. We use the Federal Reserve Board’s Distributional Financial Accounts (DFAs) as our data set, which give quarterly estimates of nominal, aggregate U.S. household wealth. Wealth, or net worth, is defined as the sum of assets less liabilities. We make two important adjustments to the DFAs:
- We adjust for inflation using the consumer price index, yielding household wealth values in real terms. This adjusts for changes in the purchasing power of a dollar over time.
- We also adjust for household population. This allows us to account for changing group sizes and to express wealth in terms of the average family’s household finances.
The result is average, inflation-adjusted household wealth values, available from 1989 onward on a quarterly basis.
The State of U.S. Wealth Inequality supplements our other research that generally uses median wealth instead of average wealth—producing different estimates of racial, generational and educational wealth gaps.
The Federal Reserve Board creates the DFAs by combining data from the triennial Survey of Consumer Finances (SCF) and the quarterly Financial Accounts of the United States. See a paper by the Board of Governors of the Federal Reserve System for a discussion of how the estimates are constructed. Many of our reports, such as the Demographics of Wealth series, use the SCF instead of the DFAs. The SCF is an extensive survey that allows us to examine median household wealth (wealth at the middle or 50th percentile), which we believe is more representative of a demographic group’s typical economic experience than is average wealth. However, the SCF is released only every three years, with the most recent survey featuring 2019 data.
While we prefer the depth of information provided by the SCF data, the DFAs allow us to study wealth trends in a more timely fashion, though with less flexibility than the SCF and an inability to examine median household wealth. Because specific DFA estimates change from quarter to quarter as data are updated, we advise placing more weight on trends than on specific values. Overall, as average wealth trends roughly track median wealth trends, we find large wealth gaps and low levels of wealth among vulnerable groups using both the SCF and DFAs. Because of how wealth is distributed, average wealth estimates are much higher than median wealth estimates and therefore are not representative of a typical (i.e., median) family’s experience.


Subscribe to receive insights, research-based essays and upcoming events from the Institute for Economic Equity.
Views expressed are not necessarily those of the St. Louis Fed or Federal Reserve System.
