

Stubborn Inflation, Economic Resilience Major Themes in U.S. Outlook
KEY TAKEAWAYS
- At its June 2023 meeting, the FOMC refrained from raising the target range for the federal funds rate, which remains at 5% to 5.25%.
- In response to tighter monetary policy, as well as to lower energy prices and moderating food price inflation, headline inflation is falling; however, core inflation remains stubbornly high.
- The U.S. economy continues to perform better than expected, as evidenced by positive real GDP growth, continued healthy gains in employment and a low unemployment rate.
Job No. 1 for the FOMC: Returning Inflation to the 2% Target
The Federal Open Market Committee’s strategy to return inflation to its 2% target remains the major theme in the U.S. economic outlook. Since March 2022, the FOMC has raised its target range for the federal funds rate by 500 basis points, from 0%-0.25% to 5%-5.25%. The FOMC left the target range unchanged at its June 2023 meeting, but Federal Reserve Chair Jerome Powell said in the press conference following the meeting (PDF) that “nearly all committee participants view it as likely that some further rate increases will be appropriate this year to bring inflation down to 2% over time.”
The Fed’s actions have slowed the rate of inflation and reduced inflation expectations. From its peak of 7% in June 2022, a 41-year high, the 12-month percent change in the headline (all items) personal consumption expenditures price index (PCEPI) declined to 4.4% in April 2023. The more widely followed consumer price index (CPI) slowed from its peak of 9.1% in June 2022 to 4.1% in May 2023.The 12-month percent change in the CPI is based on the data series that is not seasonally adjusted. In May 2023, the seasonally adjusted CPI was up 4% from a year earlier. Nonmonetary factors have also helped to slow inflation, notably lower energy (crude oil and natural gas) prices and slowing food price increases.
Most professional forecasters contend that the Fed’s tightening actions have raised the probability of a recession over the next 12 months. However, a higher real federal funds rate has yet to trigger widespread slowing of the U.S. economy. Since the second quarter of 2022, U.S. real gross domestic product (GDP) has increased at a 2.4% annual rate.
Conceptually, an economy expands through the combined effects of labor input, capital investment and technological innovations. The latter two series are broadly captured in labor productivity growth, a key determinant of living standards over the long run. Disconcertingly, labor productivity has only risen at a 0.2% annual rate over the past three quarters. This means that rising labor input has been the primary driver of output growth.
Employment and hours worked are two widely followed measures of labor input. From March 2022 through May 2023, payroll employment increased by 4.7 million, an average of 334,000 jobs per month. Indeed, the increase in May, at 339,000 jobs, was much stronger than expected. Over the same period, March 2022 through May 2023, indexes of aggregate weekly hours worked increased at a 1.7% annual rate.
The combination of healthy output growth and a strong demand for labor, including continued high levels of job vacancies, has kept the unemployment rate relatively low and nominal wage growth relatively high. In May 2023, the unemployment rate measured 3.7%, nearly unchanged from the rate that prevailed in March 2022 (3.6%). What’s more, the Atlanta Fed’s smoothed wage growth tracker increased by 6% over the 12 months ending May 2023.
The strength in labor markets has also buoyed the growth of real personal consumption expenditures (PCE) on goods and services. During the past three quarters (from the third quarter of 2022 through the first quarter of 2023), the growth of real PCE has contributed an average of 1.6 percentage points to this period’s overall real GDP growth of 2.4%. Auto sales have been especially strong, despite rising interest rates on new car loans.
Rising interest rates have been less benign for other interest-sensitive industries. Housing—sales and construction—is one such industry. From March 2022 to April 2023, real residential construction outlays have declined by 18.4%, and total home sales (new and existing) have declined by 20.8% through May 2023. Contacts in the industry suggest that, besides higher mortgage rates, low levels of homes available for purchase have stunted sales. There are signs, though, that housing may have bottomed. Total home sales and housing starts are up modestly year to date, and bidding wars on homes for sale have returned to some areas of the country.
Does the Fed Have More Wood to Chop?
The latest data thus suggest that Fed tightening actions have lowered inflation, but also that they have yet to materially weaken the broader economy. The implication is twofold. First, monetary policy probably is not sufficiently restrictive. (St. Louis Fed President James Bullard recently argued that monetary policy is currently at the low end of what is arguably sufficiently restrictive given current macroeconomic conditions.) Second, it is possible—and maybe even likely—that the effects of the Fed’s policy rate increases will not manifest themselves for several more months. But opinion appears divided on how long the lag between policy rate changes and their impact on the macroeconomy may be.
As an example, the Treasury yield curve—the difference between the yield on 10-year Treasury securities and three-month Treasury securities—typically inverts during Fed tightening episodes and often presages recessions. This measure of the yield curve has been inverted since November 2022. A 2018 analysis found that, on average, a business cycle peak occurs 10 months after the yield curve inverts. Taken literally, this finding suggests a recession could start soon. It is possible that the rise in the unemployment rate from 3.4% in April 2023 to 3.7% in May could be an important signal in this regard. But as noted, other indicators suggest that labor market conditions remain vibrant.
Given few signs of an imminent recession, the Fed’s focus is squarely on inflation. Core (or trend) inflation, which excludes food and energy prices, is stubbornly high and will likely remain well above the FOMC’s 2% inflation target well into 2024.
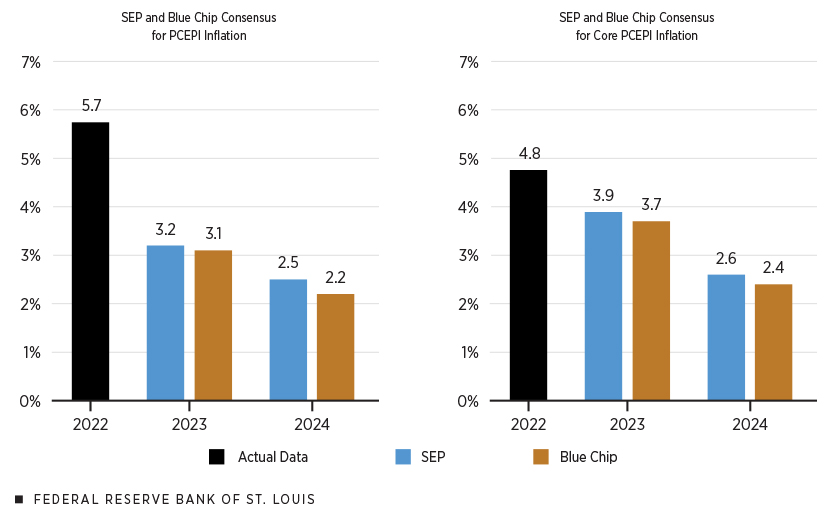
In the June 2023 Summary of Economic Projections (SEP), the median FOMC participant expects core PCEPI inflation to fall from 4.8% in 2022 to 3.9% in 2023 and to 2.6% in 2024 (see the following figure). Through April 2023, core PCEPI inflation was up 4.7% from a year earlier, and core CPI inflation was up 5.3% through May. Implicitly, then, professional forecasters and FOMC participants are expecting a significant slowing in core inflation over the remainder of the year and into 2024. The FOMC’s projections are conditioned on the likelihood of further rate increases.
Projections for Inflation, 2023–24
Projections for Real GDP Growth and Unemployment, 2023–24
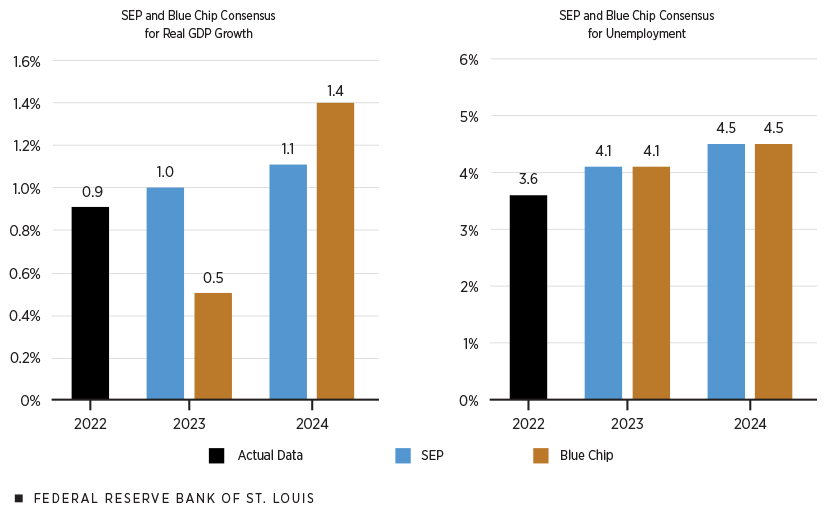
SOURCES FOR THE TWO FIGURES: Federal Reserve Board of Governors (June 2023 SEP) and Wolters Kluwer (June 2023 Blue Chip Economic Indicators).
NOTES FOR THE TWO FIGURES: Actual and forecasted growth for PCEPI and core PCEPI inflation and real GDP are percent changes from the fourth quarter of the previous year to the fourth quarter of the year indicated. For unemployment, the actual and forecasted values are the averages of monthly data for the last three months of the year, that is, the fourth quarter of the year indicated. SEP projections are based on the median projected value for each series.
At the same time, FOMC participants acknowledge that uncertainty about the outlook for inflation remains very high. Inflation could decline by more than anticipated over the near term if energy prices plunge, or if the U.S. economy slows by more than expected or falls into a recession. Minutes from the March 2023 FOMC meeting suggest that Federal Reserve Board staff expect a mild recession to begin later this year because of recent turmoil in the banking sector. As of yet, though, financial market stress—as measured by the St. Louis Fed Financial Stress Index—remains slightly below average. The Blue Chip consensus generally aligns with the Federal Reserve Board staff’s expectation of a recession later this year.
Upside inflation risks also are present. As noted above, the economy has exhibited surprising strength over the last three quarters. And real GDP growth could surprise to the upside again in the second quarter of 2023, if the Atlanta Fed’s forecast tracking model, GDPNow, is accurate. Thus, if the economy continues to strengthen, and if monetary policy is not sufficiently restrictive, then inflation might not fall as much as expected.
Other risks lie outside the FOMC’s control and compound the challenge it faces in bringing inflation back down to its 2% target. Among these risks are uncertainty about the global economy arising from the war in Ukraine and emerging weakness in China’s economy; the potential for higher commodity prices, and thus consumer price inflation, arising from a developing El Niño weather pattern and drought conditions across large portions of the Midwest; and the potential for higher crude oil prices.
Conclusion
The economy is always responding to unexpected developments, or what economists call shocks. Thus, the outlook for the U.S. economy and inflation could look very different a few months from now. That is a key reason why forecasting is difficult. At present, though, one word that describes the current macroeconomic environment is resilience—resilience when it comes to the overall economy and resilience in underlying, or trend, measures of inflation.
Note
- The 12-month percent change in the CPI is based on the data series that is not seasonally adjusted. In May 2023, the seasonally adjusted CPI was up 4% from a year earlier.

Views expressed in Regional Economist are not necessarily those of the St. Louis Fed or Federal Reserve System.
For the latest insights from our economists and other St. Louis Fed experts, visit On the Economy and subscribe.
Email Us
