


Deconstructing Hours Worked: How Did Recent Recessions Differ?
The unemployment rate is arguably the best-known indicator of labor market conditions, yet it is only one among many that the Fed closely monitors in maintaining its dual mandate of maximum employment and price stability. Labor market tightness and the possibility of a “soft landing,” for example, has garnered a lot of attention so far in 2023. Hours worked, which was recently brought up by policymakers, is another.
In this blog post, we constructed a monthly index of usual weekly hours worked per capita to examine the evolution of weekly usual hoursUsual hours worked reflect a person’s normal work schedule. during and after the two most recent recessionary episodes: the Great Recession and the COVID-19 recession. To study the drivers of changes in hours worked, we deconstructed the weekly usual hours per capita index into three subindexes: weekly usual hours per worker, the employment rate and the labor force participation (LFP) rate.
(De)constructing the Weekly Usual Hours per Capita Index
Data for constructing the index of weekly usual hours per capita come from the Current Population Survey (CPS). For each month, we divide total usual hours worked per week among all nonfarm private employees by the civilian noninstitutional population. That is:
Total usual hours per week divided by Civilian population
This gives us monthly moments of weekly hours per capita. To obtain the index, we then divide the current month’s moment by the average of the 12 months in the base year, 2007.
Note that weekly usual hours per capita can be delineated into three components: (a) weekly usual hours per worker, or the intensive margin (b) the employment rate, or the extensive margin, and (c) the LFP rate. Formally, the above equation can be written out as:
Total usual hours per week divided by Employed population × Employed population divided by Labor force population × Labor force population divided by Civilian population
The employed population and labor force population appear in both the numerator and denominator, thereby canceling each other out. Deconstructing the hours per capita index this way allows us to study the driving forces behind the evolution of hours per capita since 2006.
Differences in the Evolution of Weekly Usual Hours Worked: Great Recession vs. COVID-19 Recession
The first and second figures plot the weekly usual hours per capita (solid black), weekly usual hours per worker (dotted blue), employment rate (dashed orange), and labor force participation rate (dash-dotted green) indexes. While the first figure shows the entire time series, highlighting the Great Recession and its recovery, the second figure zooms in on the COVID-19 recession.
Decomposition of Weekly Usual Hours per Capita
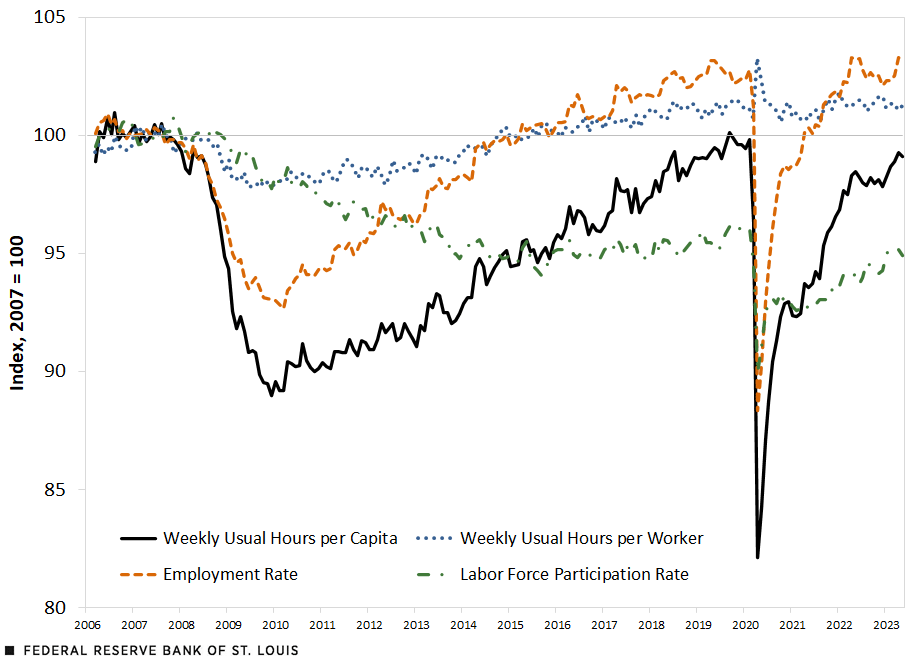
SOURCES: Current Population Survey and authors’ calculation.
Focusing first on the Great Recession, we observe a decline of about 11% in weekly usual hours per capita over the course of the Great Recession, from an index of around 100 in December 2007 to about 89 in December 2009. Hours per capita gradually returned to their pre-Great Recession level only in late 2019.
Yet this is neither the case for weekly usual hours per worker nor the employment rate. Weekly hours per worker returned to its pre-Great Recession level in 2015, and the employment rate even surpassed its pre-Great Recession level right in 2016. The decomposition reveals an important result: The slow recovery of weekly usual hours per capita was driven by the LFP rate, which has yet to recover—and has remained roughly 5% below its pre-Great Recession level well into 2023.
We shift our attention now to the COVID-19 episode, highlighted in the second figure. With the initial shock of the pandemic, weekly usual hours per capita, the employment rate and the LFP rate all sharply dropped in April 2020, but just as quickly started to bounce back throughout the summer of 2020. While the LFP rate shortly became sluggish—albeit still on an upward trend—and has yet to return to its pre-pandemic level, the employment rate continued a strong recovery, helping lift weekly hours per capita.
Decomposition of Weekly Usual Hours per Capita: COVID-19 Pandemic
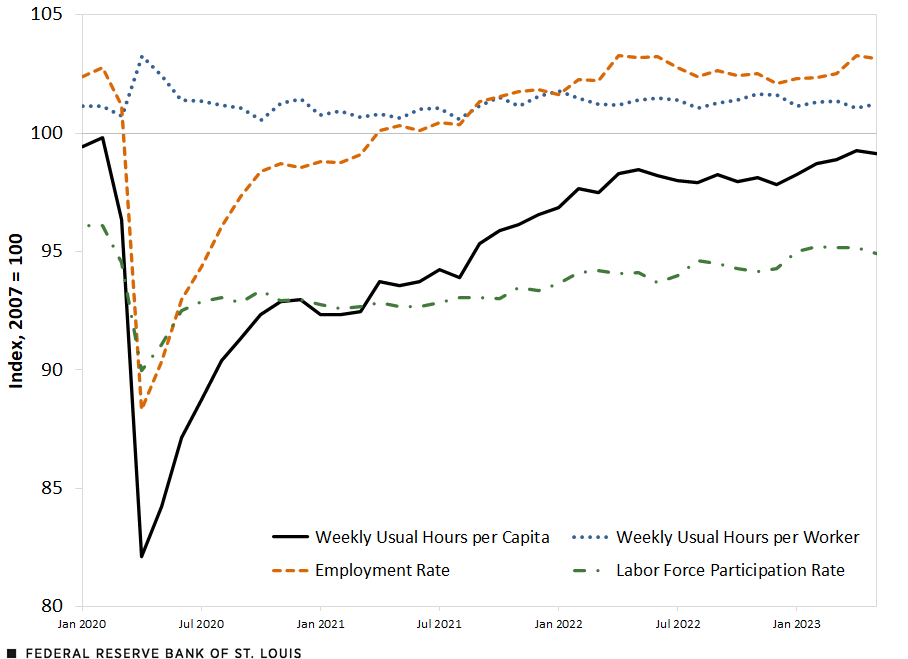
SOURCES: Current Population Survey and authors’ calculation.
Weekly usual hours per worker, on the other hand, spiked at the onset of the pandemic. This was likely due to a compositional change within the stock of employed workers at the time: As workers were laid off en masse—often temporarily—those who remained employed had longer working hours. By the summer of 2020, we saw an immediate decrease in weekly hours per worker to pre-pandemic levels. Weekly hours per worker remained relatively stable throughout the pandemic and into 2023, playing an important part in the recovery of weekly hours per capita.
Conclusion
Like a few other labor indicators, such as job switching and job separation rates, weekly usual hours per capita had a slow recovery from the Great Recession, which was largely driven by the LFP rate’s lack thereof. By contrast, during the pandemic, weekly hours per capita plummeted at the initial shock but has been fast approaching its pre-COVID-19 levels, due to the stability of weekly usual hours per worker throughout the pandemic and the employment rate’s rapid recovery.
Note
- Usual hours worked reflect a person’s normal work schedule.


Citation
Serdar Birinci and Trần Khánh Ngân , ldquoDeconstructing Hours Worked: How Did Recent Recessions Differ?,rdquo St. Louis Fed On the Economy, Aug. 1, 2023.
This blog offers commentary, analysis and data from our economists and experts. Views expressed are not necessarily those of the St. Louis Fed or Federal Reserve System.
Email Us
All other blog-related questions