


How Job Separations Differed between the Great Recession and COVID-19 Recession
The Great Recession (2007-09) and COVID-19 recession have a lot in common—both downturns unleashed huge shocks to the labor market. The two recessions have quite a lot of differences, however. The Great Recession stemmed from a global financial crisis, whereas the COVID-19 recession was an outcome of a global pandemic. Naturally, due to their discrepant nature, the two recessions have had much different consequences for the labor market.
In this post, we will discuss the differing ramifications of each recession on job separation rates, analyzing outcomes for the aggregate as well as heterogeneously across earnings groups.
Aggregate Effects
For our analysis, we used data from the Current Population Survey (CPS) to track the employment status of U.S. workers. In our original investigation, we focused on aggregate job separation rates—the percentage of previously employed workers who became unemployed in the reported month. This measure gives us an idea of how often individuals are being laid off or quitting their jobs without transferring to a new position.
The first figure plots the smoothed monthly job separation rate from January 2005 to April 2021.Rates are seasonally adjusted and smoothed with a three-month averaging process. We use this process to remove noise from the data, making important trends clearer. It is important to note that the smoothing process gives us a clearer understanding of the important trends, but it also means the values for each month do not perfectly align with the actual separation rate.
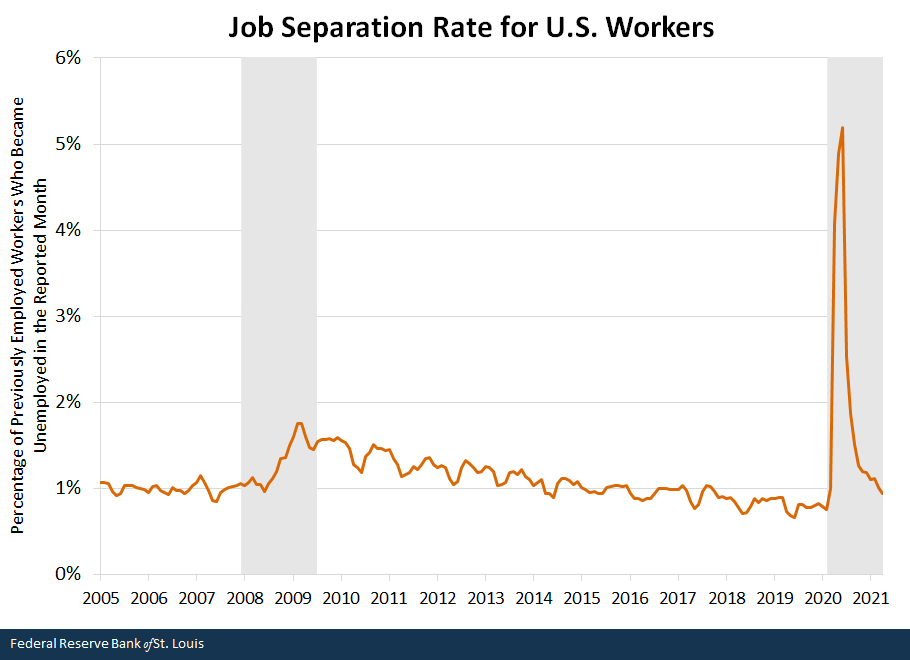
NOTES: Rates are seasonally adjusted and smoothed with a three-month averaging process. Gray shading represents recessions; the most recent end date is undecided.
SOURCES: Current Population Survey and authors’ calculations.
In the case of the Great Recession, there was not a strong initial mass of separations, but instead as the recession deepened, separations became more prominent. The rate steadily increased between June 2008 and February 2009, nearly doubling from 1% to 1.8%. Following its peak in February 2009, the rate then began to slowly decrease and returned to pre-recession levels by mid-2014—about five years after the recession’s end.
When the focus is shifted to the right side of the figure, it becomes clear that the Great Recession and pandemic recession were two very different contractions. From March to April 2020, there was an explosive increase in the rate, clearly associated with the shutdown-related layoffs at the pandemic’s start. The rate peaked in June 2020 at 5.2%, which was more than five times March’s rate of 1%.If we exclude the smoothing process, the rate peaked at a much larger rate of 10% in April 2020. As noted earlier, the Great Recession did not have a comparable initial shock to the separation rate. Another key difference was in the shape of the recovery. As opposed to the slow recovery after the Great Recession, in which the separation rate came back to its pre-recession level after around five years, the pandemic recession’s separation rate began to rapidly recover directly after the initial shock. By April 2021—about a year after the recession’s start—the rate had declined to below 1%.
Effects by Earnings Group
To extend our findings further, we also explored the job separation rates broken out by earnings groups. First, we grouped occupations into quintiles based on the average annual earnings of individuals in each line of work.We used 2019 earnings to group occupations into quintiles. When using 2006 earnings to separately group occupations into quintiles for the analysis on the Great Recession, we got nearly identical results. More details on this calculation, together with examples of occupations in each quintile, are provided in our Economic Synopses essay. Then we calculated the job separation rate for workers in each occupational earnings quintile. The two figures below display these job separation rates during the Great Recession and the pandemic recession.
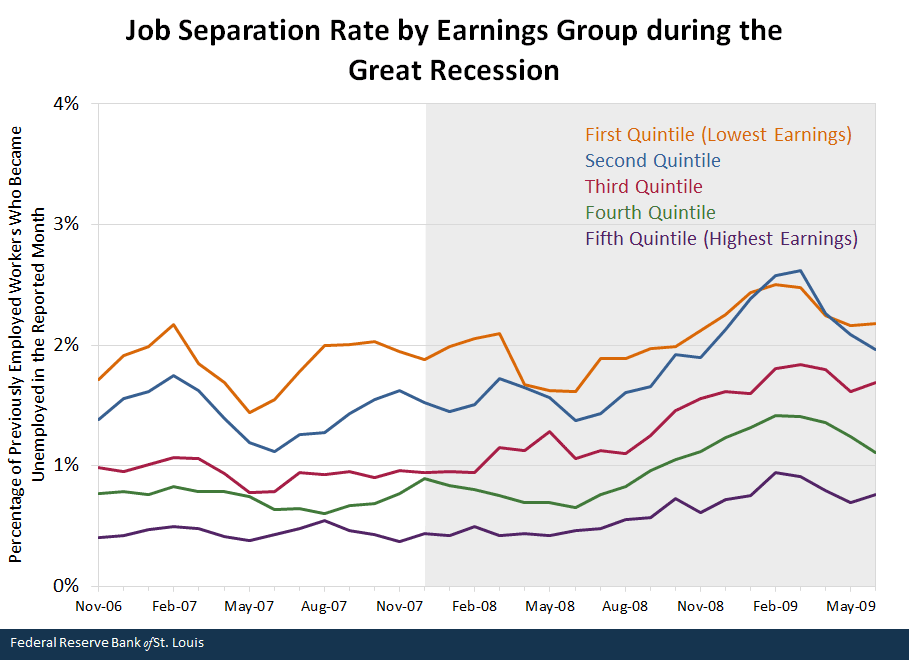
NOTES: Rates are seasonally adjusted and smoothed with a three-month averaging process. Occupations are grouped into quintiles based on workers’ average annual earnings, ranked from lowest to highest. The gray shading represents the recession.
SOURCES: Current Population Survey and authors’ calculations.
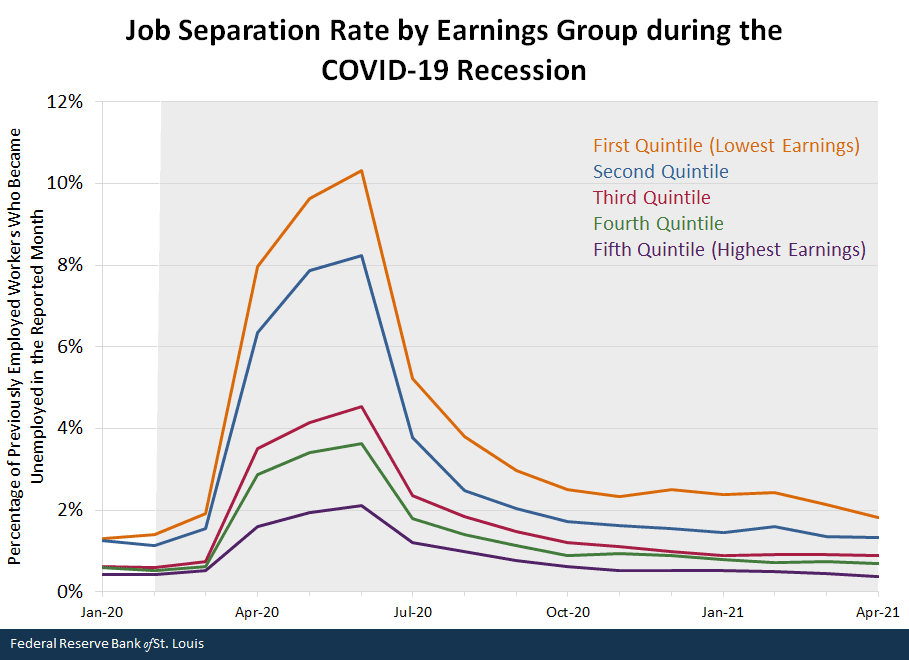
NOTES: Rates are seasonally adjusted and smoothed with a three-month averaging process. Occupations are grouped into quintiles based on workers’ average annual earnings, ranked from lowest to highest. The gray shading represents the recession; the end date is undecided.
SOURCES: Current Population Survey and authors’ calculations.
In both recessions, job separation rates were consistently higher for lower-earnings groups—that is, workers in lower-earnings occupations tend to quit without a job in hand or to be laid off more often than those in higher-earnings occupations. Similarities between the two figures end there, however.
The Great Recession’s effects on job separation rates were quite homogeneous across earnings groups. For example, from January 2007 (11 months before the recession began) to February 2009 (four months before the recession ended), rates increased by 0.5 percentage points for both the first quintile (Q1), the lowest-earnings group, and the fifth quintile (Q5), the highest-earnings group. The other quintiles faced similar increases.
In contrast, the COVID-19 recession had disproportionate effects on the separation rates of earnings groups. From January to June 2020, the Q1 job separation rate increased by 9 percentage points, from 1.3% to 10.3%. Between these dates, the Q5 rate increased by only 1.7 percentage points, from 0.4% to 2.1%.
Different Origin, Different Symptoms
The Great Recession and COVID-19 recession had different causes and thus affected the labor market in different ways. In the aggregate, the earlier recession was a slow burn. The negative effects of the financial crisis took time to spread into the labor market, but these effects were long-lasting.
Meanwhile, the start of the pandemic recession was characterized by government-mandated shutdowns of many contact-intensive industries (e.g., services). This explains the initial shock to job separation rates, especially for individuals in lower-earnings occupations, which are typically in a more contact-intensive line of work. Job separation rates were also much quicker to recover in the recent recession, likely due to the more artificial nature of their increase. After the initial shock, individuals who kept their jobs were unlikely to be laid off, and those that were laid off were likely to stay unemployed or find work in a less effected occupation.
Notes and References
- Rates are seasonally adjusted and smoothed with a three-month averaging process. We use this process to remove noise from the data, making important trends clearer.
- If we exclude the smoothing process, the rate peaked at a much larger rate of 10% in April 2020.
- We used 2019 earnings to group occupations into quintiles. When using 2006 earnings to separately group occupations into quintiles for the analysis on the Great Recession, we got nearly identical results. More details on this calculation, together with examples of occupations in each quintile, are provided in our Economic Synopses essay.
Additional Resources
- On the Economy: COVID-19’s Effects on Dual-Earner Households
- On the Economy: How Has the COVID-19 Recession Affected U.S. Labor across Occupations and Industries?
- On the Economy: Labor Market Engagement and the Pandemic’s Impact on American Workers


Citation
Serdar Birinci and Aaron Amburgey, ldquoHow Job Separations Differed between the Great Recession and COVID-19 Recession,rdquo St. Louis Fed On the Economy, June 22, 2021.
This blog offers commentary, analysis and data from our economists and experts. Views expressed are not necessarily those of the St. Louis Fed or Federal Reserve System.
Email Us
All other blog-related questions