

Social Distancing and Contact-Intensive Occupations
While social distancing is crucial for addressing the health shock caused by COVID-19, it has also reshaped the landscape of economic activity. The impact, however, is likely to be considerably heterogeneous across occupations.
In particular, nonessential occupations that require a high degree of face-to-face and close physical interaction are particularly likely to be hit hard, as consumers reduce their demand for them in pursuit of social distancing. Thus, these occupations are likely to be more vulnerable to the shock, leading either to layoffs of nonessential workers or to an increase in the risk of contagion among those workers that have to stay in the workplace to perform essential activities. Carrying out some of these occupations remotely, when plausible, is likely to allow them to better absorb the negative shock.
In this blog post, we attempt to characterize which occupations are these contact-intensive occupations that are likely to be relatively more affected by the COVID-19 pandemic and how important these occupations are for the U.S. economy.
Working Proximity to Other People
To do so, we combined individual-level data from the 2017 American Community Survey with an index of occupational contact-intensity from O*NET.We restricted our attention to employed men and women ages 25-64. Individuals across a very large number of occupations covering the entire U.S. economy are asked by O*NET to answer questions on the mix of knowledge, skills, abilities and work context (among other characteristics) that best describe their occupations.
One of these questions involves rating the extent to which the job requires the worker to perform job tasks in close physical proximity to other people. The answers are given scores, which are aggregated to compute a contact-intensity index. The possible answers and corresponding scores are:
- I don’t work near other people (beyond 100 ft.): 0
- I work with others but not closely (e.g., private office): 25
- Slightly close (e.g., shared office): 50
- Moderately close (at arm’s length): 75
- Very close (near touching): 100
We then classified occupations into low, medium and high contact-intensity categories according to index scores of 0 to 50, 50 to 75, and 75 and above, respectively. The table below lists the high contact-intensity occupations.
| Occupation | Proximity index | # of workers | Avg. # of hours worked per week | Avg. annual labor income | % of U.S. workforce |
|---|---|---|---|---|---|
| Barbers, Hairstylists and Cosmetologists | 92.17 | 1,097,556 | 36.00 | $17,334 | 0.87% |
| Occupational Therapy and Physical Therapist Assistants and Aides | 90.50 | 95,730 | 36.22 | $41,846 | 0.08% |
| Home Health and Personal Care Aides; and Nursing Assistants, Orderlies and Psychiatric Aides | 90.25 | 1,614,277 | 37.03 | $25,991 | 1.28% |
| Therapists, Veterinarians, Nurses, Midwives and Audiologists | 88.09 | 4,070,995 | 38.28 | $65,743 | 3.22% |
| Supervisors of Food Preparation and Serving Workers | 88.00 | 846,895 | 42.31 | $32,805 | 0.67% |
| Health Care Diagnosing or Treating Practitioners | 86.19 | 1,543,291 | 46.42 | $167,744 | 1.22% |
| Supervisors of Personal Care and Service Workers | 84.50 | 107,558 | 42.11 | $36,586 | 0.09% |
| Health Technologists and Technicians | 82.73 | 2,600,424 | 38.82 | $44,271 | 2.06% |
| Pilots, air traffic controllers and flight attendants | 81.60 | 281,574 | 41.13 | $105,009 | 0.22% |
| Other Health Care Support Occupations | 80.20 | 1,148,226 | 36.62 | $30,497 | 0.91% |
| Preschool, Elementary, Middle, Secondary and Special Education Teachers | 79.54 | 4,800,982 | 41.08 | $47,769 | 3.80% |
| Other Teachers and Instructors | 79.00 | 642,712 | 34.18 | $36,841 | 0.51% |
| Motor Vehicle Operators | 75.56 | 4,099,099 | 44.22 | $37,654 | 3.24% |
| Other Personal Care and Service Workers | 75.50 | 2,474,634 | 34.70 | $18,019 | 1.96% |
| Food and Beverage Serving Workers | 75.17 | 1,866,495 | 33.67 | $22,721 | 1.48% |
| SOURCES: 2017 American Community Survey, O*NET and authors’ calculations. | |||||
Data presented in the table above is available for download.
There are 15 occupations (out of 107 occupations at the four-digit Standard Occupation Classification level) considered high contact-intensity. Barbers, hairstylists and cosmetologists are at the top of the list, with a physical proximity index of 92.17. Food and beverage serving workers are at the bottom of the high contact-intensity occupations list, with an index of 75.17. Other contact-intensive occupations include those that provide health services as well as pilots, air traffic controllers and flight attendants, and Pre-K to 12th grade teachers.
COVID-19 Effects on High Contact-Intensity Occupations
The ongoing pandemic impacts all of these occupations, but it is likely to affect each of them in a different way. For instance, while barbers, hairstylists and cosmetologists are likely to be out of business until the pandemic subsides, Pre-K to 12th grade education is already being conducted remotely in many states, mitigating the impact of the health shock.
Similarly, while many types of health services (such as non-urgent dentist appointments) are likely to be postponed until the pandemic is resolved, others will certainly be very active assisting COVID-19 patients despite the risk of contagion. The table below shows that these high contact-intensity occupations represent about one-fifth of total U.S. employment and labor income: 27.3 million workers who earn nearly $1.3 trillion annually.
| Relative contact intensity | Avg. Proximity index | Total # of workers | Avg. # of hours worked per week | Total labor income | % of U.S. workforce |
|---|---|---|---|---|---|
| Low | 47.13 | 34,405,074 | 41.64 | $2,508,096,964,282 | 27.23% |
| Medium | 60.41 | 64,669,671 | 41.10 | $3,053,444,213,704 | 51.18% |
| High | 81.73 | 27,290,448 | 39.37 | $1,297,291,601,184 | 21.60% |
| SOURCES: 2017 American Community Survey, O*NET and authors’ calculations. | |||||
Data presented in the table above is available for download.
In contrast, low contact-intensity occupations—those which are least likely to be affected by the COVID-19 shock—represent about one-fourth of total employment and about one-third of labor income: 34.4 million workers who earn $3 trillion annually. Examples of these types of occupations are designers, scientists and hunters.
States and Contact-Intensive Occupations
The heterogeneous exposure across occupations that we have documented above also translates into some heterogeneity in exposure across U.S. states, as seen in the figure below.
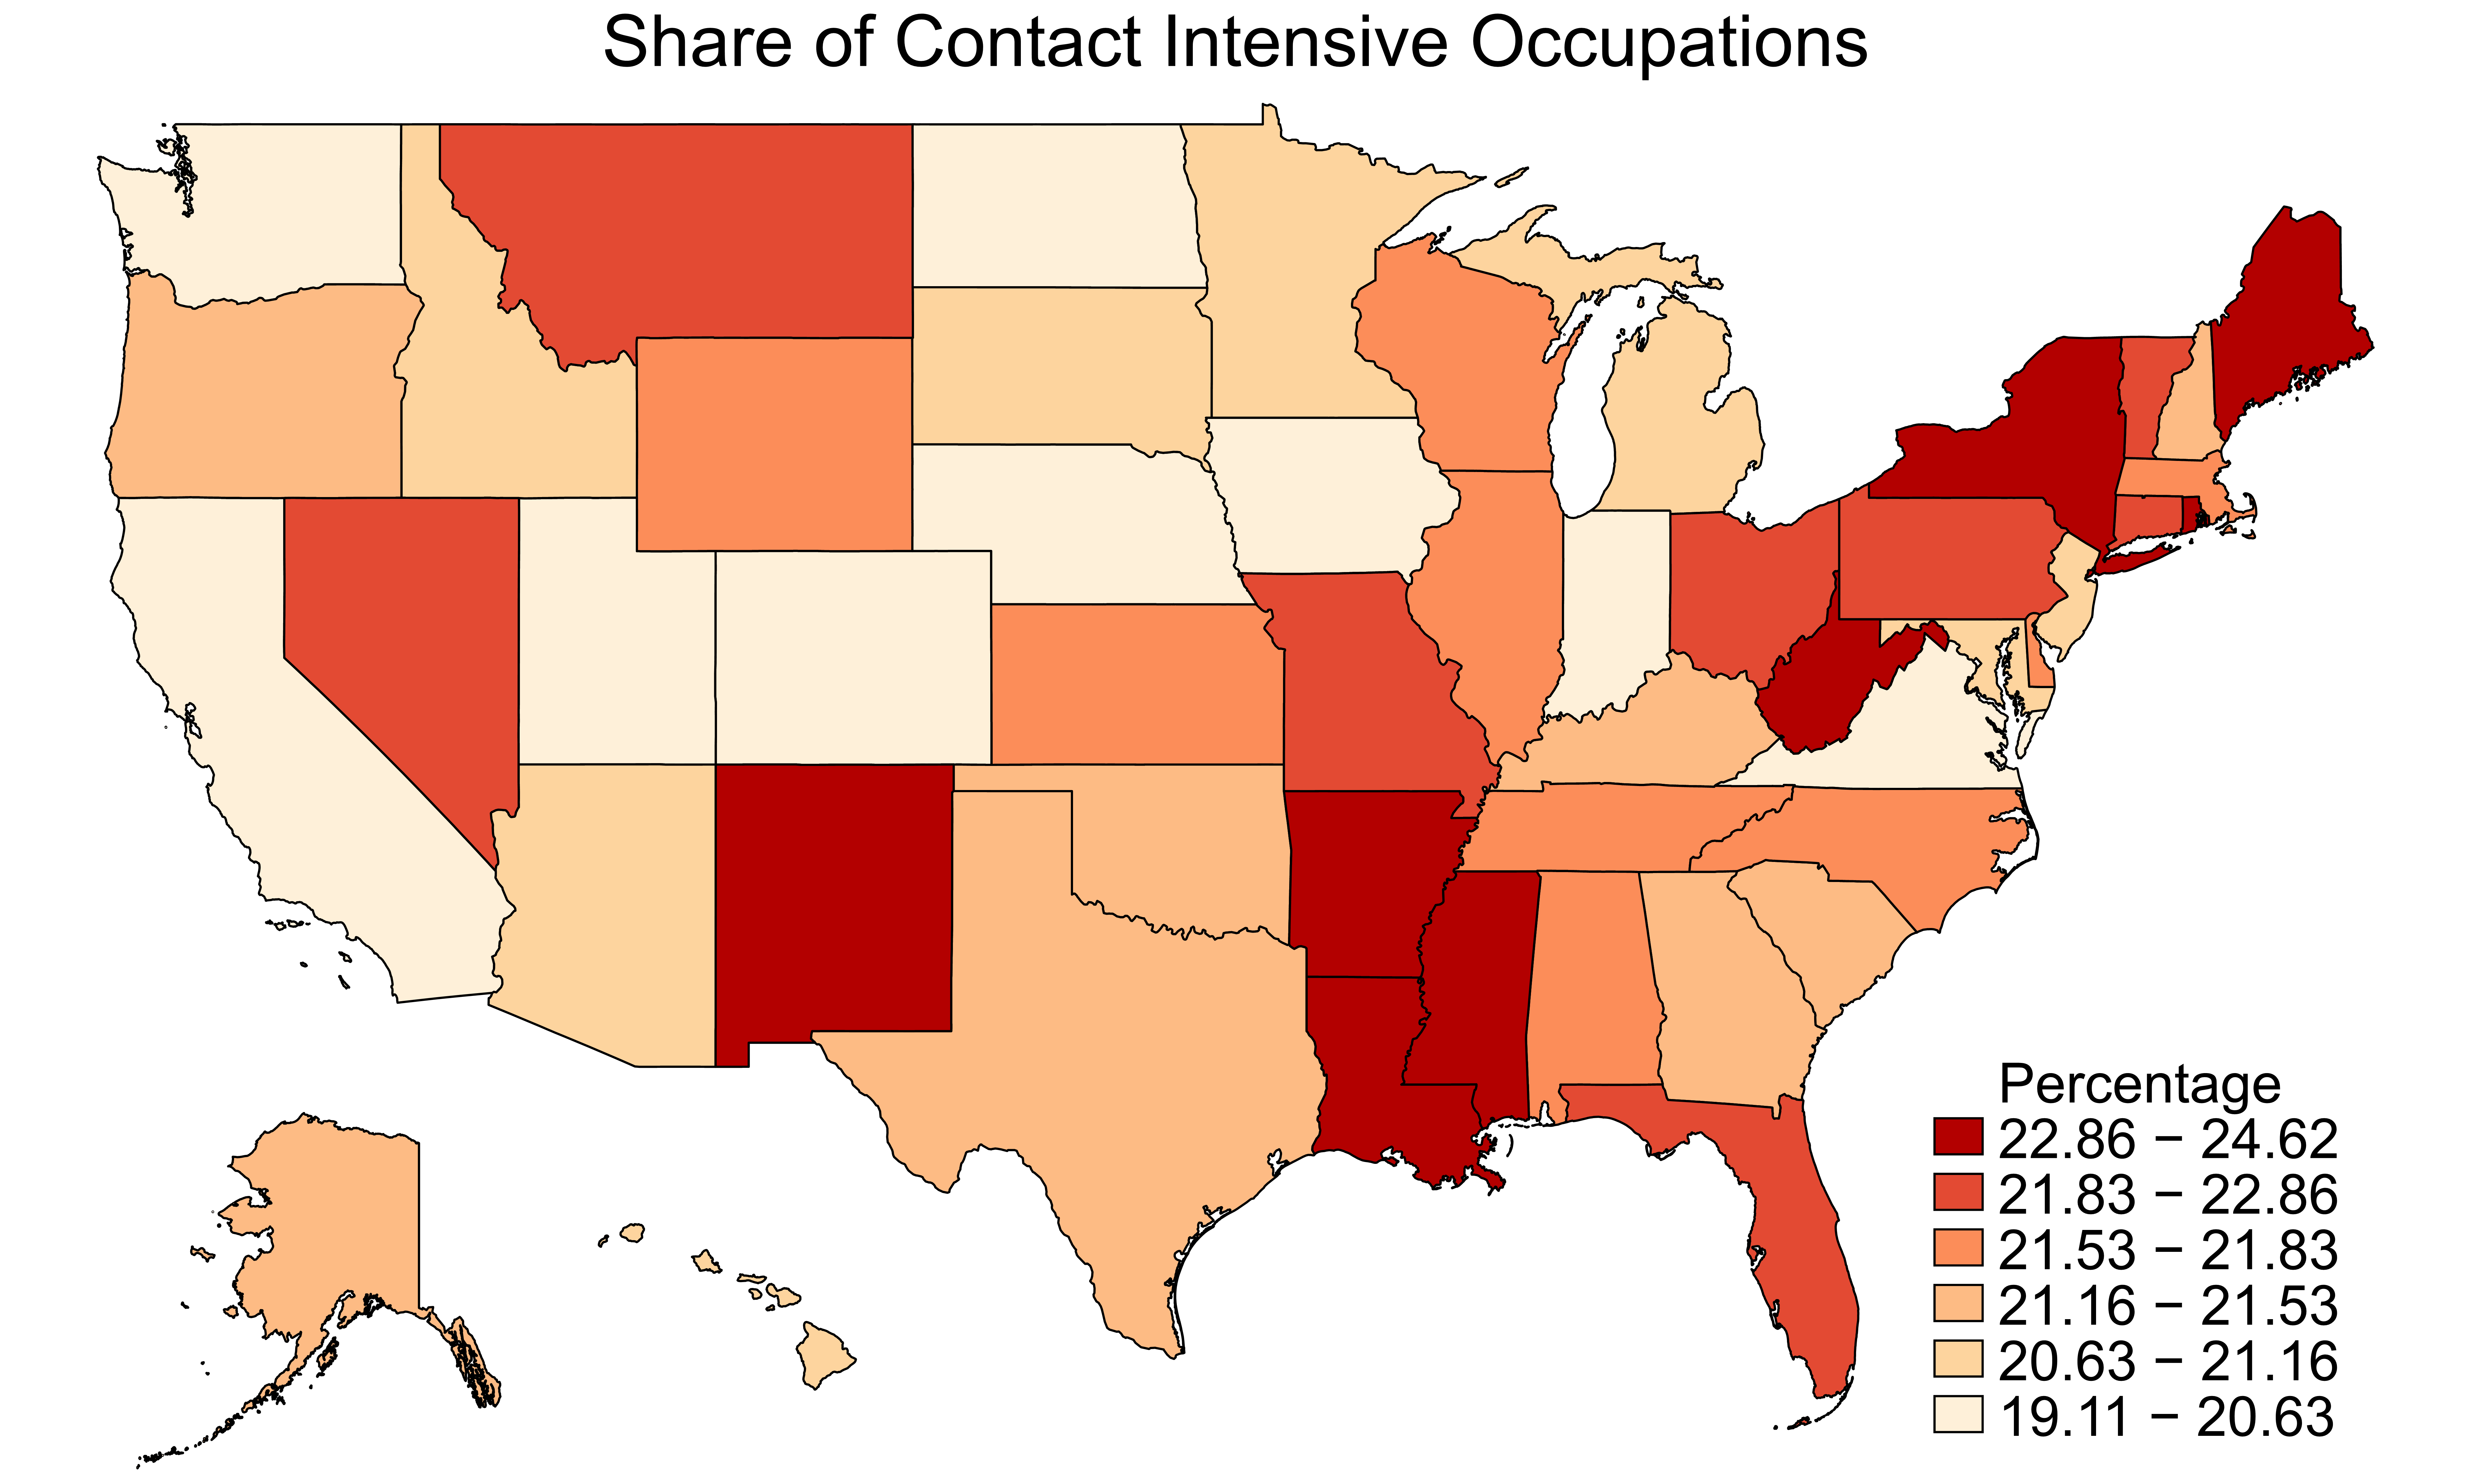
Those U.S. states where there are more occupations that require physical contact are more likely to be vulnerable to the health shock. Such states include Mississippi, New York and West Virginia with more than 24% of their workers in high contact-intensity occupations. In contrast, Virginia, Colorado and Utah may be relatively less affected, with less than 20% of their workers in such occupations.
These observations show that high contact-intensity occupations represent a non-negligible fraction of the U.S. economy in terms of employment and total labor income. Thus, the direct economic impact of COVID-19 via the recent social-distancing measures is likely to be significant.
However, the overall impact will depend on the flexibility of these occupations to adapt to this alternative social environment. If more occupations can be done remotely, then the impact is likely to be mitigated.
Notes and References
1 We restricted our attention to employed men and women ages 25-64.
Additional Resources
- St. Louis Fed’s COVID-19 resource page
- Working Paper: Fiscal Policy during a Pandemic
- Economic Synopses: Possible Fiscal Policies for Rare, Unanticipated, and Severe Viral Outbreaks
This post was updated to use total labor income instead of total income. The update does not change the authors’ analysis or conclusions.


This blog offers commentary, analysis and data from our economists and experts. Views expressed are not necessarily those of the St. Louis Fed or Federal Reserve System.
Email Us
All other blog-related questions
