


Are Students Borrowing Too Much? Or Too Little?
Total student debt has risen to levels greater than credit card and auto debt, leading to increasing worries from many policymakers and institutions. One of these concerns, for example, is that those high debt burdens would prevent students from pursuing socially beneficial careers.
As we noted in a recent Regional Economist article, New York University made its medical school tuition free for fear that higher debt burdens would deter students from becoming doctors. Also, Michael Bloomberg—the billionaire and former New York City mayor—made the largest contribution ever to any higher-education institution in the U.S., donating $1.8 billion to Johns Hopkins University to be devoted exclusively to financial aid. This fall, Johns Hopkins became a loan-free institution as it replaced all undergraduate student loans with scholarships.
Which type of student debt policies can generate the largest social gains? To properly answer this question, it is important to take the differences across borrowers into account, as student debt is not equal across all borrowers. Policies aiming to alleviate student debt should take this heterogeneity into account.
Debt balances have usually a hump shape over time for each borrower. Students start accumulating debt, then they graduate and continue repaying the loan over the next 10 years, on average.
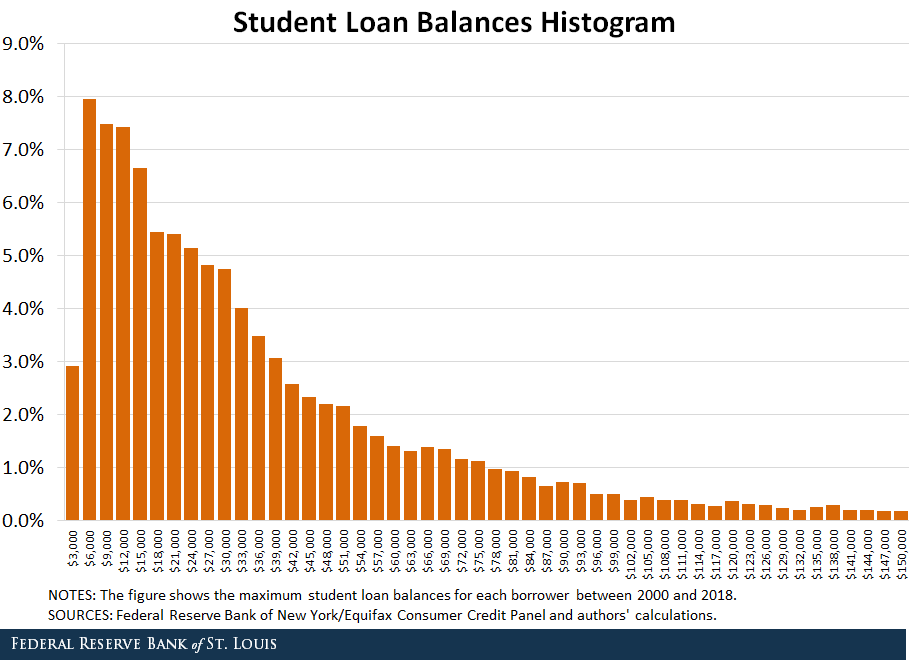
For each borrower, we computed the maximum of the loan balances between 2000 and 2018 to capture the maximum amount borrowed for each student. The figure above shows the histogram of the peak of debt balances.We computed the maximum balances of each borrower. From the Consumer Credit Panel covering student loans, we annualized the balances, adjusted for inflation and kept those individuals with strictly positive balances in 2018. For students who started repaying their debt, we kept those individuals who had at least one period before 2018 in which their balance decreased, and we recorded their maximum level of debt. To address outlier values, balances greater than $150,000 were dropped. These balances represented less than 4% of the sample. The mean is about $34,000, while the median is considerably less at around $25,000. The figure shows the distribution clearly skewed to the right, with 5% of the students owing more than $100,000.
Moreover, the range between the 20th and the 80th percentiles, approximately two-thirds of borrowers, include student loan balances between $10,000 and $54,000. These numbers show a large variation in student debt balances.
Student Loan Balances
Mean — $ 34,150
Median — $ 24,899
20th Percentile — $ 9,703
40th Percentile — $ 19,125
60th Percentile — $ 31,312
80th Percentile — $ 54,497
95th Percentile — $ 99,025
99th Percentile — $ 135,472
SOURCES: Federal Reserve Bank of New York/Equifax Consumer Credit Panel and author's calculations.
Considerations for Student Debt Policies
In light of the variation in student debt balances, student debt policies should account for the differential responses of borrowers across the distribution. The data suggest that some students seem to be borrowing too much, while others, perhaps, too little.
However, borrowing is an endogenous outcome, and the heterogeneity reflects primitive sources of differences across students. To properly answer the original question and design effective student debt policies, researchers should consider the primitive sources of heterogeneity—such as demographics, wealth, other financial burdens and the chosen field of study—in student debt accumulation. Such factors may contribute to the observed large variance in student debt balances.
Without considering these heterogeneities, it will be hard to design effective policies to improve the credit market for students. Changes in policy will likely generate different effects across the debt distribution, encouraging some students to take more debt or less debt, depending on their backgrounds and the particular change in policy.
Notes and References
1 We computed the maximum balances of each borrower. From the Consumer Credit Panel covering student loans, we annualized the balances, adjusted for inflation and kept those individuals with strictly positive balances in 2018. For students who started repaying their debt, we kept those individuals who had at least one period before 2018 in which their balance decreased, and we recorded their maximum level of debt. To address outlier values, balances greater than $150,000 were dropped. These balances represented less than 4% of the sample.
Additional Resources
- Regional Economist: What Is Driving Student Debt in the Eighth District?
- On the Economy: How Do Students Pay for College?
- On the Economy: Marriage, Young Households and Student Loan Debt


Citation
Julian Kozlowski and Mahdi Ebsim, ldquoAre Students Borrowing Too Much? Or Too Little?,rdquo St. Louis Fed On the Economy, Sept. 16, 2019.
This blog offers commentary, analysis and data from our economists and experts. Views expressed are not necessarily those of the St. Louis Fed or Federal Reserve System.
Email Us
All other blog-related questions