


How Do Students Pay for College?
It is well-known that college tuition has gone up significantly over the past few decades. How do college students finance their tuition expenditures? Do they work more while in college, rely more heavily on parental support, borrow more or opt for lower quality schools?
To answer these questions, we explored the finances of two different cohorts of students:
- Those who went to college in the early 1980s
- Those who went to college in the early 2000sFor financial variables in the 1980s, we used the High School & Beyond dataset. For college-type choice in both years and financial variables in the 2000s, we used the 1979 and 1997 National Longitudinal Surveys of Youth. This research was conducted with restricted access to Bureau of Labor Statistics (BLS) data. The views expressed here do not necessarily reflect the views of the BLS.
The main source for information regarding college selectivity is the Integrated Postsecondary Education Data System. We categorized all colleges in the U.S. into four types. The lowest type refers to community colleges offering two-year general education programs. Four-year institutions are categorized into three types according to the average SAT score of the freshman class, so that each type accounts for one-third of freshmen enrollment.
Tuition Breakdowns
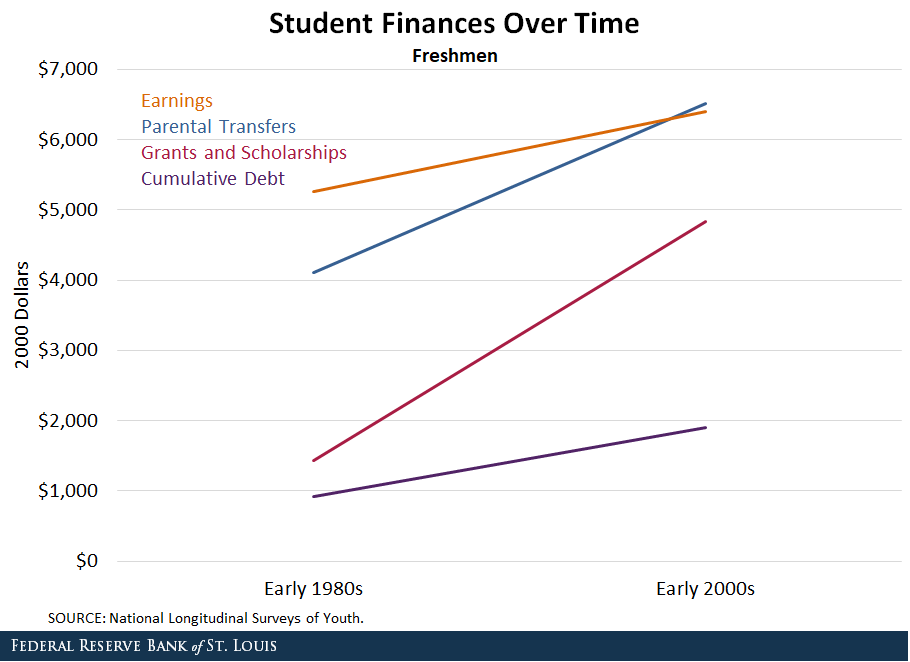
The average tuition paid by freshmen tripled for the younger cohort, from $4,000 to $13,552.All quantities are quoted in 2000 dollars. Even though grants and scholarships also increased, the direct cost of college (tuition payments net of grants and scholarships) more than doubled, from $3,628 to $8,624. Because tuition isn’t reported in NLSY79, we obtained tuition estimates for the older cohort from the High School and Beyond survey, conducted by the National Center for Education Statistics.
The figure below shows that the younger cohort had to rely more heavily on parental transfers, work more while in college and accumulate more student debt. Student earnings appear to be the least responsive source of revenue, according to percentage growth. It should be noted that students were earning roughly the same amount per hour in both time periods. The increase is mostly due to students working more hours.
We also found that, while only 30% of freshmen in the 1980s were enrolled in community colleges, 36% chose to do so in the 2000s. This downgrading of college type happened for students that would have typically enrolled in the least selective four-year school. Community colleges are cheaper and make it easier for students to hold a part-time job: In the 2000s, these students worked an average of 23 hours per week versus an average of 17 hours across all students.
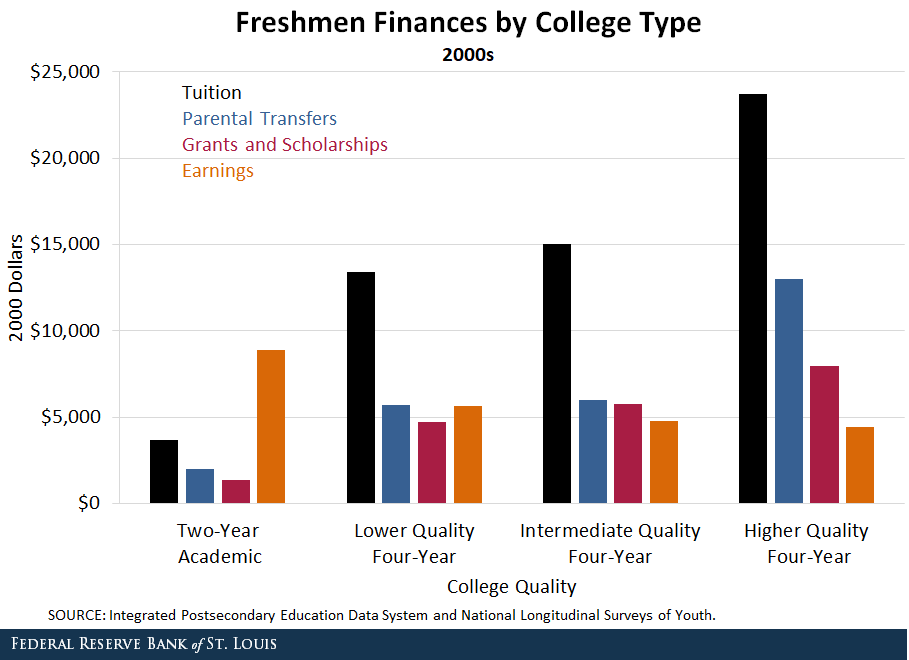
The figure below breaks down student finances by college type. We found that freshmen enrolled in the most selective four-year schools faced greater tuition rates but received more scholarships and help from their parents. They also worked fewer hours (12 hours per week), which likely allowed them to focus on their studies.
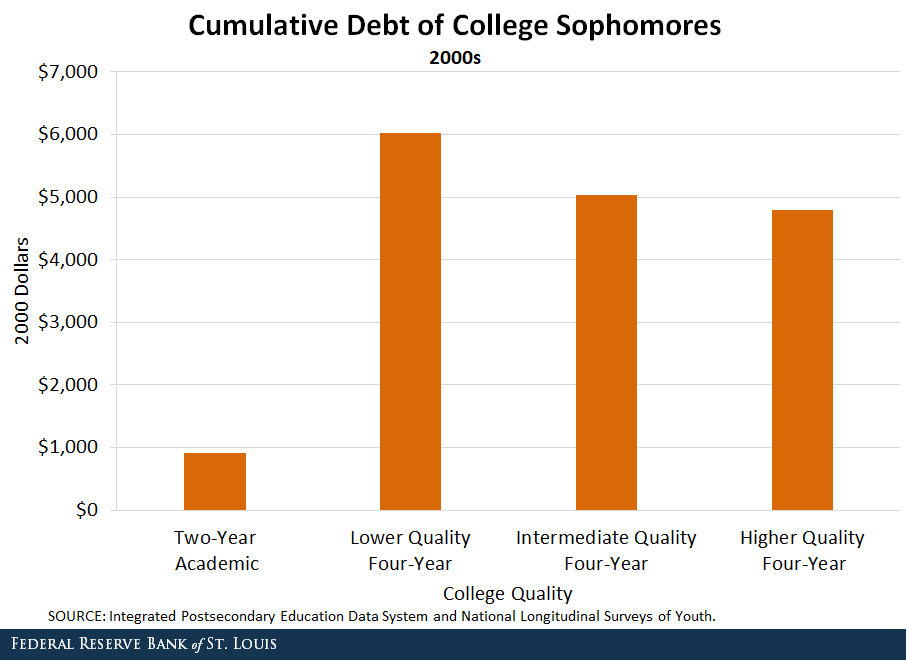
The figure below shows cumulative debt by college type at the end of the second year of studies. We see that the four-year college students attending the lowest quality schools actually held the most in debt, as they received less scholarships and parental help.
Only 18% of community college students had any debt, and those who did averaged $911 in debt at the end of their second year. It is unlikely that these students entered college to tap into government-sponsored loan programs.
One reason why four-year college students did not borrow more despite facing high tuition rates could be that the borrowing limits for government-sponsored Stafford loans remained relatively strict. Freshmen could borrow up to $2,625 in 2000, and sophomores could borrow up to $3,500.
(The figures used in this post were updated with full sources for the data.)
Notes and References
1 For financial variables in the 1980s, we used the High School & Beyond dataset. For college-type choice in both years and financial variables in the 2000s, we used the 1979 and 1997 National Longitudinal Surveys of Youth. This research was conducted with restricted access to Bureau of Labor Statistics (BLS) data. The views expressed here do not necessarily reflect the views of the BLS.
2 All quantities are quoted in 2000 dollars.
3 Because tuition isn’t reported in NLSY79, we obtained tuition estimates for the older cohort from the High School and Beyond survey, conducted by the National Center for Education Statistics.
Additional Resources
- On the Economy: The Disparate Wealth Paths for College Grads of Different Races/Ethnicities
- On the Economy: Growing Gaps in College-Attainment Rates
- On the Economy: Born on 3rd Base? The Effects of Head Starts and College on Family Wealth

Citation
Oksana Leukhina, ldquoHow Do Students Pay for College?,rdquo St. Louis Fed On the Economy, Sept. 5, 2019.
This blog offers commentary, analysis and data from our economists and experts. Views expressed are not necessarily those of the St. Louis Fed or Federal Reserve System.
Email Us
All other blog-related questions