


What Is Driving Student Debt in the Eighth District?
KEY TAKEAWAYS
- Concerns about student loan debt have grown as students incur greater burdens and take longer to repay this debt.
- Between 2013 and 2017, the average student debt in the Eighth District grew 17% in real terms versus 22% for the U.S.
- In the Eighth District, tuition is a more important driver of student debt than nontuition costs, like room and board, relative to the drivers of student debt in the U.S.

As student loan debt has risen to a level greater than credit card and auto debt, concerns have kept pace. There are worries across the nation that higher debt burdens on graduates can be financially detrimental and a deterrent to socially beneficial careers.
New York University, for example, made its medical school tuition-free for fear that higher debt burdens would deter students from becoming doctors. Last year, Michael Bloomberg, the billionaire and former New York City mayor, made the largest contribution ever to any higher-education institution in the U.S., donating $1.8 billion to Johns Hopkins University to be devoted exclusively to financial aid. Massachusetts state Senator Eric P. Lesser claims that “college debt is a monster that’s ruining lives,” and the White House has proposed federal student loan caps for graduate students and parents of undergraduates.See Hackman and Mitchell.
Average student debt (i.e., the average balance per borrower in 2012 dollars) has grown to around $30,000 nationally. Between 2013 and 2017, student debt grew by 22%, while tuition (in 2012 dollars) grew by 9%. Thus, other forces besides tuition increases must be behind the increase in student debt.
In light of these concerns, it is important to see how student debt levels in the Eighth Federal Reserve DistrictHeadquartered in St. Louis, the Eighth Federal Reserve District includes all of Arkansas and parts of Illinois, Indiana, Kentucky, Mississippi, Missouri and Tennessee. compare with the national average to determine the severity of the debt burden, as well as to discuss what factors contribute to the differences in debt burdens across the District.Our analysis uses the Federal Reserve Bank of New York/Equifax Consumer Credit Panel. This is used to estimate the average student loan balance (total balance divided by number of borrowers in the panel) and repayment length (average of estimated time for a borrower to pay off the balance). The Integrated Postsecondary Education Data System (IPEDS) from the Education Department provides state-level data on total fall enrollment and tuition for full-time undergraduates, excluding less than two-year institutions. Average tuition is weighted by total fall enrollment. The figures discussed summarized data from 2017. Debt balances do not identify where a student attended school. However, 81% of students remain students in their home state, according to Table 309.10 in the 2017 Digest of Education Statistics.
Student Debt Levels
Average student debt is 14%* lower in the Eighth District ($25,700 per borrower in 2012 dollars) than in the nation ($30,000). From 2013 to 2017, average student debt grew by 17% in the District versus 22% nationally. Over the same period, enrollment was mostly unchanged in the Eighth District and nationwide, while tuition increased by 12% in the District versus 9% nationwide.
We can decompose the increase in average student debt into tuition and nontuition-related borrowing, like room and board or other student expenses. It seems that only 5% of average student debt growth in the Eighth District cannot be attributed to increased tuition, compared with 13% for the aggregate economy. This seems to imply that tuition is a relatively more important driver of student debt growth in the Eighth District, and policies related to tuition reduction—like the NYU or JHU examples—can have particularly larger effects in reducing student debt in the District.
Student Loan Repayment
Student debt is lower in the District than in the nation, but this does not imply that it is a less severe problem. To gain more information on how hard it is for students to repay their debt, we can look at how long it takes to repay the loans.
Average repayment length is 11.6 years in the District, while it is 12.2 years nationwide. In fact, every state in the District boasts repayment lengths shorter than the national average. From 2013 to 2017, repayment lengthened by about seven months in the District and 17 months across the country.
Are the Recent Dynamics Good or Bad Symptoms?
The lengthening of repayment periods and the increase in student debt—both in the nation and in the District—can be symptoms of two opposite scenarios.
Bad Symptoms
On the one hand, they can be “bad symptoms,” implying that:
- It’s becoming more costly to invest in education, so students have to borrow more.
- It’s becoming more difficult to repay the debt, so students are taking longer to repay the debt. This can be the case if, for example, there are lower returns to education.
Good Symptoms
On the other hand, higher debt and longer repayment can be “good symptoms.” Consider these:
- Improvements in credit access for students can allow them to borrow more and roll their balances over for longer periods.
- An increase in the return to education, together with well-functioning credit markets, allows students to bring future income to earlier stages of their lives, thereby smoothing consumption.
Therefore, one has to be cautious when interpreting statistics alone. More research is needed to separate these two opposite forces and better understand student debt. Below we show that there are significant variations in student debt, repayment and tuition across states of the Eighth District. Perhaps, future research can exploit these cross-sectional variations to try to disentangle good and bad symptoms of student debt.
Student Loans and Eighth District States
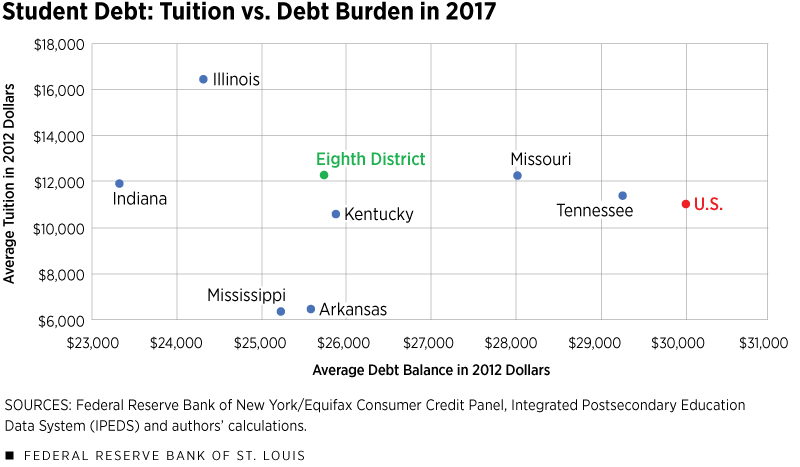
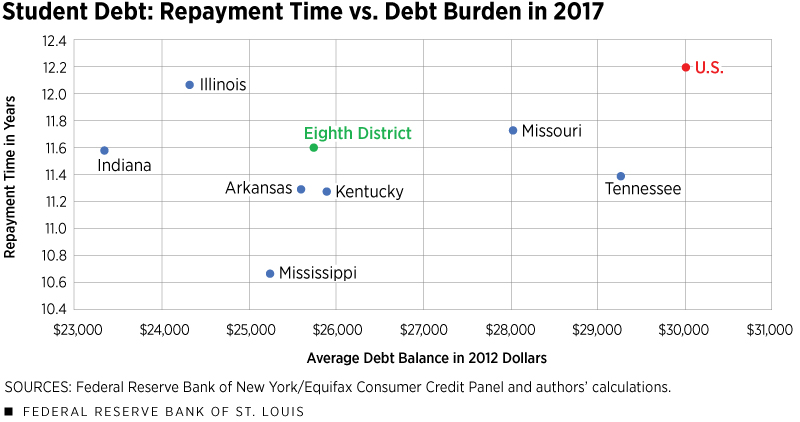
The next figures show the relationships between student debt, tuition and repayment length across District states and the U.S.
Missouri and Tennessee
Colleges in Missouri charge higher tuition than the national average, and students take longer to repay relative to students in all other states in the District except Illinois.
However, students residing in Missouri had smaller average debt balances in 2017 compared with the national average. In fact, average debt growth between 2013 and 2017 in Missouri was 6 percentage points slower than the nation’s.
From Figures 1 and 2, we note the similarity in tuition and average debt between Tennessee and Missouri. The difference between the two states is in repayment period. Missouri students take a bit longer to repay (11.7 years) versus students in Tennessee (11.4 years). This difference may stem from the higher absolute enrollment in Missouri, which may result in many more high-balance students.
Mississippi, Arkansas and Kentucky
Mississippi and Arkansas are quite similar in everything but repayment. Figure 1 shows that both pay 40% lower tuition than the national average. Also, the debt burden of around $25,500 is still significant and only 15% lower than the national average.
Enrollment in Mississippi and Arkansas is comparatively lower than in the rest of the U.S. Those who repaid loan balances in 2017 did so almost a year quicker in Mississippi than in Arkansas, maybe due to a better environment for earnings: The quicker repayment for similar debt balances and average tuition suggests that labor market outcomes for graduates in Mississippi are relatively better than for graduates in Arkansas, all other things constant.
Kentucky can also be grouped with Mississippi and Arkansas. In Figures 1 and 2, Kentucky is consistently with Arkansas and Mississippi in the bottom half, below District and national averages. This reflects commonalities in borrowing behavior for education.
Illinois and Indiana
Illinois has 50% higher tuition but 20% lower average debt burden than the national averages. However, repayment is the longest (12 years) among the District states, as seen in Figure 2, and Illinois experienced the slowest growth in average debt since 2013, at 9%.
Indiana students pay similar tuition to the national average but have 20% smaller debt balances per borrower. It is important to note that Indiana experienced tuition growth of 7% versus 12% for District states over the period 2013 to 2017. Besides relatively stable tuition, undergraduate enrollment is average compared with the youth population, and so is repayment.
Conclusion
As in the rest of the nation, student loan debt has increased in the Eighth District. This increase has also been coupled with increases in tuition.
However, these changes in the Eighth District come with significant heterogeneity, as shown in the figures for individual states. Where average tuition is similar but average debt is different, we could expect to observe differences in access to credit or returns to education across states. This is a crucial next step in this research.
Moreover, for states with similar levels of debt and tuition but different repayment rates, we ought to be concerned about what drives the different outcomes for students in different states receiving a similar level of education.
We conclude that the increase in student debt in the Eighth District is more linked to rising tuition than it is in the rest of the country, and policies related to relaxing tuition burdens—such as the NYU example—can be beneficial for the District.
*This figure was incorrect in a previous version of this article. The percentage has been amended, and the update does not affect the analysis or conclusion.
Endnotes
- See Hackman and Mitchell.
- Headquartered in St. Louis, the Eighth Federal Reserve District includes all of Arkansas and parts of Illinois, Indiana, Kentucky, Mississippi, Missouri and Tennessee.
- Our analysis uses the Federal Reserve Bank of New York/Equifax Consumer Credit Panel. This is used to estimate the average student loan balance (total balance divided by number of borrowers in the panel) and repayment length (average of estimated time for a borrower to pay off the balance). The Integrated Postsecondary Education Data System (IPEDS) from the Education Department provides state-level data on total fall enrollment and tuition for full-time undergraduates, excluding less than two-year institutions. Average tuition is weighted by total fall enrollment. The figures discussed summarized data from 2017. Debt balances do not identify where a student attended school. However, 81% of students remain students in their home state, according to Table 309.10 in the 2017 Digest of Education Statistics.
Reference
Hackman, Michelle; and Mitchell, Josh. “Trump Administration Proposes Borrowing Limits for Some Student Loans.” The Wall Street Journal, March 18, 2019.


Views expressed in Regional Economist are not necessarily those of the St. Louis Fed or Federal Reserve System.
For the latest insights from our economists and other St. Louis Fed experts, visit On the Economy and subscribe.
Email Us