

What Future Oil Price Is Consistent with Current Inflation Expectations?
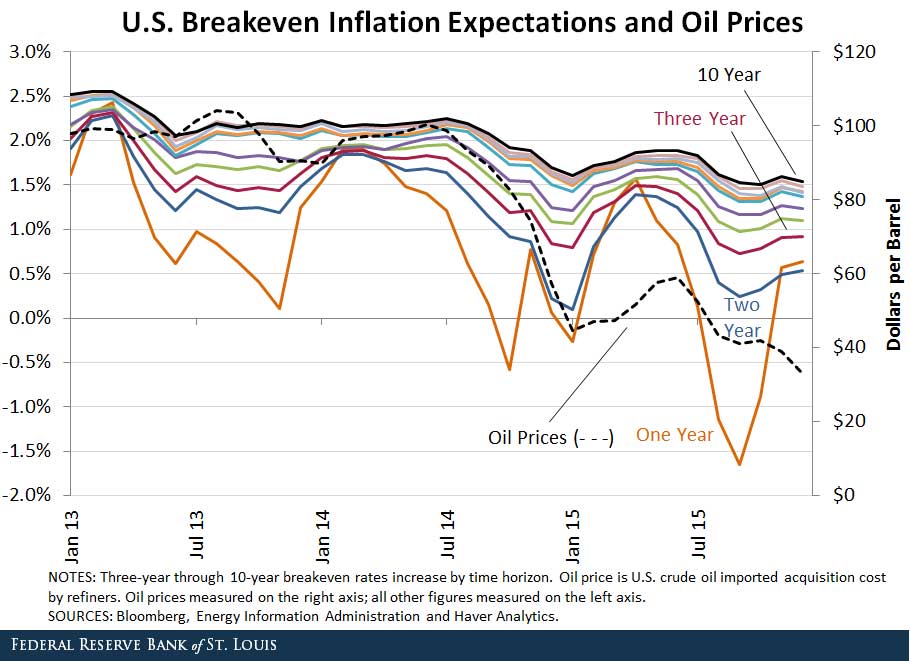
Oil prices have continued to decline over the past few months, dropping to nearly $30 per barrel by last December. This drop coincided with a fall in breakeven inflation expectations, as measured using the premium paid for Treasury inflation-protected securities (TIPS) over standard Treasury bonds.
If the fall in breakeven inflation rates reflects a fall in actual inflation expectations, and assuming this fall is largely driven by a fall in oil price expectations, then we can ask the following question: How low would future oil prices have to fall to validate current breakeven inflation rates?
To address this question, we started by calculating the future path of the consumer price index (CPI) implied by breakeven inflation expectations at December 2015 (the last observation in the figure above). Then we used a simple model to back out the future path of oil prices that is consistent with such a future path of the CPI.
The Model
The model predicts the future path of the CPI given an assumed path of future oil prices. We used it in our previous blog post to predict the impact of different future oil price scenarios on inflation rates. The model predicts the future path of the CPI as the weighted sum of two components—energy and all items less energy—under the following assumptions:
- The weights of the two components remain fixed in all future months.
- There is a constant elasticity of the energy component with respect to oil prices.
- The nonenergy components of the CPI keep inflating at the rate observed between January 2014 and June 2014.
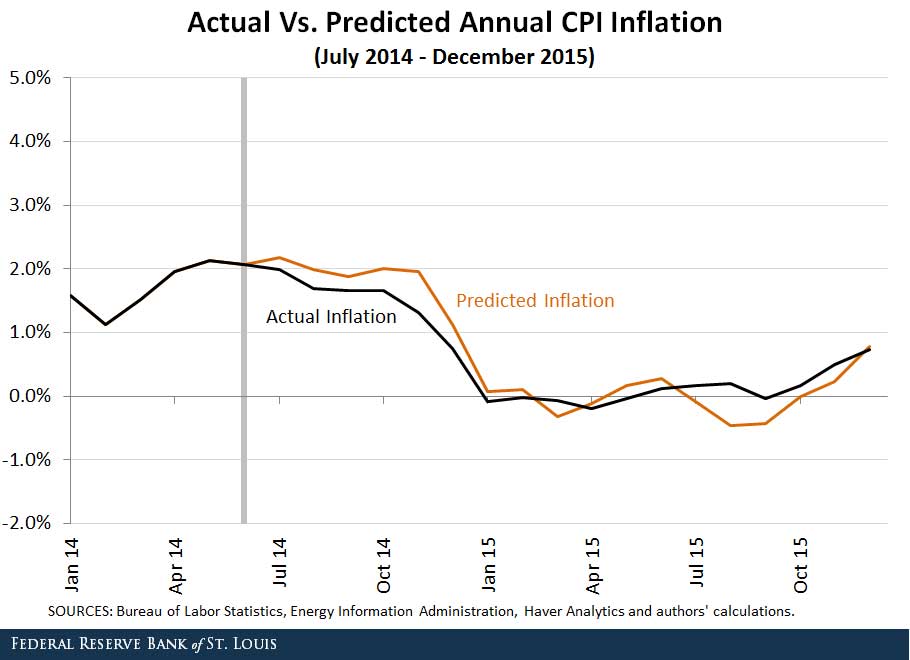
The figure below shows a backtest of our model from July 2014 to December 2015.1 As demonstrated by the figure, the model predicts the actual path of annual CPI inflation over this time period quite well.
Results
We calculated the future path of the CPI over the next 10 years (starting in January 2016) that would be consistent with breakeven inflation expectations at horizons of one year through 10 years.2 Then, using an annual growth rate of 2.87 percent for the “all items less energy” component and using 0.46 for the elasticity of the energy component with respect to oil prices, we backed out the future path of oil prices that would produce this future path of the CPI.3 The figure below displays the implied oil price series and compares it to the future oil prices implied by West Texas Intermediate crude oil futures. 4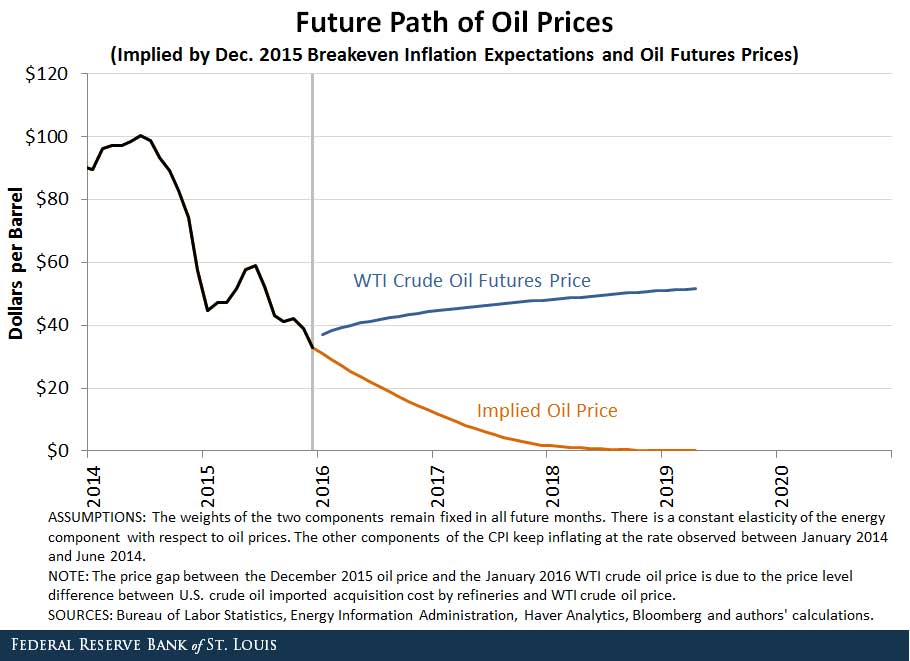
Conclusion
According to our calculations, oil prices would need to fall to $0 per barrel by mid-2019 in order to validate current inflation expectations. After that, there is no oil price that would allow our model to predict a CPI path consistent with December 2015 breakeven inflation expectations. This implied path of oil prices is very different from the path of oil prices implied by futures contracts, which rises to more than $50 per barrel by mid-2019.
We state some potential explanations for our results:
- Expectations for the future growth of the other CPI components besides energy may be lower than the annual rate of 2.87 percent we assumed in our model.
- The recent movements in breakeven inflation expectations may have been caused by something other than the decline in oil prices. It is even possible that a third variable is driving the decline in both.
- Investors may expect the relationship between oil price and the CPI energy component to change in the future. (This would be despite the strong relationship seen over the past 20 years, shown in the second figure in our previous blog post.)
- Changes in the inflation risk premium for bonds that are not inflation-protected and/or changes in the liquidity premium for TIPS may be distorting breakeven inflation expectations in the last few months.
Notes and References
1 In this backtest, we performed an out-of-sample prediction of the CPI from July 2014 to December 2015 using the actual path of oil prices over that time period. This is the future CPI path our model would have predicted in June 2014 assuming that we knew what oil prices would be through the end of 2015.
2 We used the December 2015 breakeven inflation expectations to estimate December values of the CPI over the next 10 years from December 2016 to December 2025. We obtained the remaining monthly CPI values by assuming constant growth of the CPI between each of these December estimates.
3 The value of the elasticity of energy component with respect to oil price was estimated via ordinary least squares. See the second figure of our previous blog post.
4 An oil futures contract is a standardized agreement, tradable between parties on an organized exchange, for the seller to deliver a certain quantity of oil to the buyer on a future date at a specific price determined today. The prices of such contracts are often interpreted as the market’s forecasts of spot oil prices.
Additional Resources
- On the Economy: Predicting the Impact of Oil Prices on Inflation
- On the Economy: The Relationship between Wage Growth and Inflation
- On the Economy: Which States Are Most Affected by Falling Oil Prices?

This blog offers commentary, analysis and data from our economists and experts. Views expressed are not necessarily those of the St. Louis Fed or Federal Reserve System.
Email Us
All other blog-related questions
