


Community Investment Explorer: St. Louis
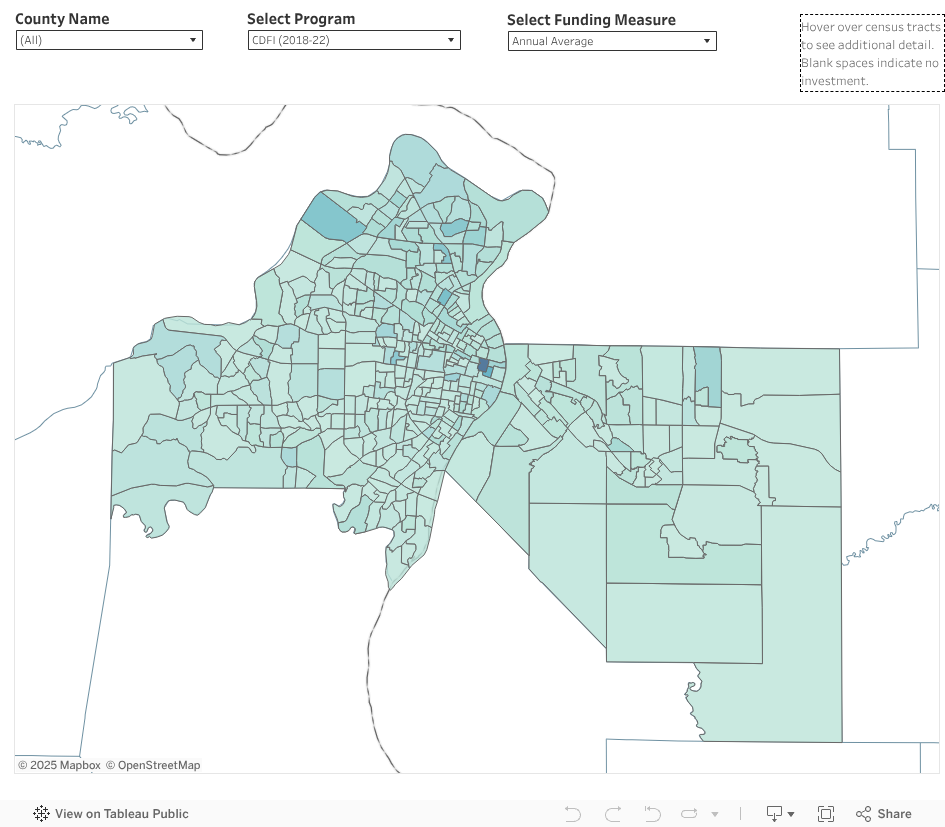
Community Investment Explorer (CIE) is an interactive tool for examining the distribution of community and economic development capital. Use the dropdowns on the map below to filter data. Hover over an area to view additional information.
Community and Economic Development Capital in St. Louis
- Historic Tax Credit (HTC) investment in the St. Louis metro area increased substantially between 2018 and 2021. It peaked in 2020, when it reached nearly 5% of all HTC investment nationwide.
- Community Development Financial Institution (CDFI) lending increased 169% in the St. Louis metro area between 2018 and 2022, driven by higher lending in low- and moderate-income neighborhoods.
- In 2021, the St. Louis metro area attracted nearly 20% of all New Markets Tax Credit investment nationally, highlighting the program’s significance as a competitive advantage for the region.
Learn more:
Cite CIE
Please use the following to cite estimates or figures from this tool: Federal Reserve Bank of St. Louis, Community Investment Explorer, https://www.stlouisfed.org/community-development/data-tools/community-investment-explorer, accessed on [date].