


Community Investment Explorer: Louisville
Community Investment Explorer (CIE) is an interactive tool for examining the distribution of community and economic development capital. Use the dropdowns on the map below to filter data. Hover over an area to view additional information.
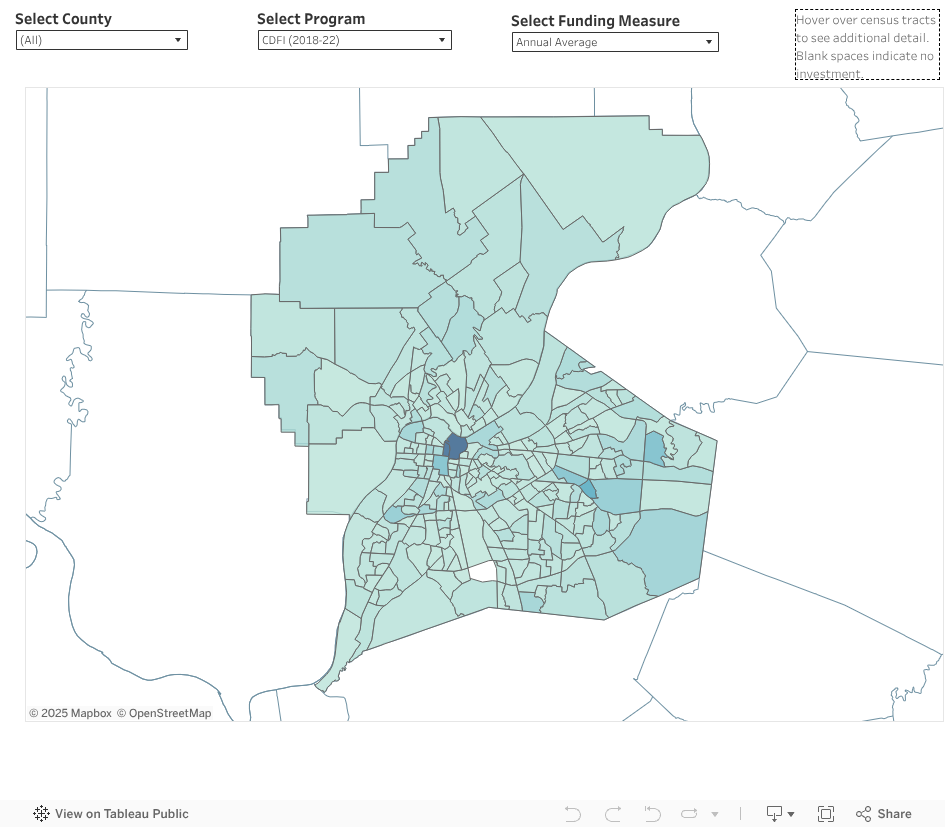
Community and Economic Development Capital in Louisville
- After minimal Low-Income Housing Tax Credit (LIHTC) investment from 2016 to 2019, this type of investment surged to more than $62 million in 2020. However, it remained concentrated in low- and moderate-income (LMI) neighborhoods, potentially reinforcing poverty and limiting upward mobility in the area.
- Community Development Financial Institution (CDFI) lending grew from $25 million in 2021 to $266 million in 2022, well above the $8 million in 2018. While more than half of funding went to LMI areas in 2020, that share dropped to 24% in 2022, suggesting a shift in investment patterns to middle- and upper-income communities.
- Community Reinvestment Act (CRA) Small Business Lending peaked in 2020, likely due to the Paycheck Protection Program, part of the federal economic stimulus package during the COVID-19 pandemic. While CRA Small Business Lending remained a key source of community and economic development capital, it fell in 2022 to 9%, below 2018 levels after adjusting for inflation.
Learn more:
Cite CIE
Please use the following to cite estimates or figures from this tool: Federal Reserve Bank of St. Louis, Community Investment Explorer, https://www.stlouisfed.org/community-development/data-tools/community-investment-explorer, accessed on [date].