

Economic Data Tracking Trends and New Tools
Historic job losses in April. Sharp declines in industrial production. Employment growth in May that took many people by surprise.
Changes in economic data reflect the economic effects of the COVID-19 pandemic, and even people who don’t usually track those changes are paying attention. As people look for help in visualizing and understanding economic releases, use of the St. Louis Fed’s economic data tool, FRED, has grown.
FRED provides free access to more than 765,000 data series in one place, and links the data to a mix of tools to help people interact with and share the data. Since the Dow Jones Industrial Average plunged in late February on coronavirus fears, traffic to the database has jumped nearly 54% from year-ago levels. For the year through May, visits to the site topped 7 million.
The increase “could be a sign that people are eager to understand the impact this pandemic can bring to their lives and what it might mean for future behavior and spending,” said Yvetta Fortova, who manages the data desk team that ensures accuracy and around-the-clock updates to the economic data tool.
Which economic series have drawn the most attention lately? How has the FRED team met demands for frequent data updates during the pandemic? I put those questions to Fortova and Keith Taylor, who serves as FRED data officer, and Maria Arias, FRED data engineer. Along the way, they shared some new and notable series and dashboards that data followers won’t want to miss.
Most Popular Series

“We’ve seen a dramatic increase in weekly jobless claims, which climbed to nearly 7 million in late March,” Taylor said.
When that happened, “Initial claims knocked off a common Treasury yield spread to become our most popular series,” he said.
Taylor explained that negative yield curve values—reflecting a yield curve inversion—have preceded every recession since 1957. An inversion occurs when the interest on a short-term debt like two-year Treasuries is higher than the interest on a long-term debt like 10-year Treasuries.
That series remains closely watched.
After the late March jobless claims report, “it’s been a domino effect of difficult news,” Taylor said.
He noted that, in April:
- 20.7 million jobs were lost
- The unemployment rate climbed to 14.7%
- Industrial production dropped by 12.5%
In addition to these unprecedented numbers, quarterly real GDP turned negative for the first time since 2009 in the first quarter. Data seekers have come to FRED to view these and other economic numbers in the news.
With more frequent visits, daily and weekly series have moved up on the database’s popular series list. The daily ICE BofA U.S. High Yield Index Option-Adjusted Spread, a measure of default risk in the corporate bond market, topped this list—surpassing initial claims—in mid-June. At that time, the Fed’s balance sheet, updated weekly, was among the top five series.
New Interactive Dashboards and Maps

Fortova highlighted two new dashboards of charts for tracking key economic and financial data. The economic data dashboard includes initial claims for unemployment insurance benefits. The financial data dashboard has information on markets, such as the Dow Jones Industrial Average stock market indicator.
Some features of the dashboards:
- Graphs that update automatically as new data become available
- The ability to save, download and modify the dashboards
- The ability for users to share the dashboards with their networks
“This interactive tool can be useful especially during times when consumers need to learn and absorb information quickly and efficiently,” Fortova said.
FRED presents what’s happening in the economy through the latest available data from third-party sources, Fortova said. A larger collection of resources can be found on the COVID-19 Research page.
“During these unfortunate times, we’re working continuously to make FRED useful and valuable,” she said.
Another innovative introduction has been the launch of a map feature for data series with geographic traits. Users can click on the green “VIEW MAP” button on select charts to reveal and hover over data displayed by country, state, metro area, etc.
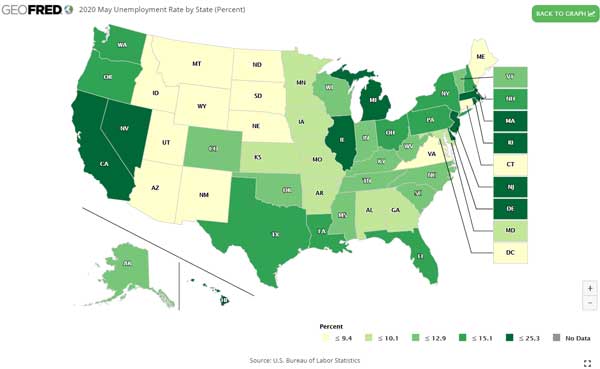
“This creates a new dimension of looking at the data, in addition to the time series, which show trends or changes over time,” Fortova said.
Data Series You Don’t Want to Miss
If tracking financial volatility is top of mind for you, Data Engineer Arias would point you to the weekly St. Louis Fed Financial Stress Index, which was recently revamped “to better capture evolving stress in financial markets.” The index is constructed from 18 weekly data series.
Demand has played a role in the introduction of an economic index, Taylor said.
“With COVID-19 having such a fast impact on the economy, we’ve seen more interest in higher frequency data,” he said.
In response, the team recently added the Lewis-Mertens-Stock Weekly Economic Index. The index uses 10 daily and weekly indicators on consumer behavior, the labor market and production to signal the state of the U.S. economy on a weekly basis.

Arias pointed to other recent additions relevant for the times.
- Daily and monthly series that track equity market volatility, or stock market changes, related to infectious diseases
- Quarterly series for 143 countries and a world aggregate that track uncertainty related to pandemics and discussion about pandemics
Although their methodology is slightly different, the infectious disease and pandemic-related series are based on counts of the word “uncertainty” in the context of terms that relate to infectious disease or pandemics, Arias noted.
Arias highlighted another addition to the database: the U.S. Census Bureau’s Weekly Business Formation Statistics. This weekly release includes the number of new business applications, including those with planned wages and those with a high propensity of turning into businesses with payrolls.
Arias noted that most of the new series are released with a short lag—daily, with data as of the prior day, or weekly, with data as of the prior week. “This is beneficial for users who are looking for recent data to understand the quickly changing economic and financial conditions,” she said.
More to Explore
To keep up with all that’s new or to learn more about FRED:
- Read the FRED Blog
- Check out announcements
- Subscribe to the newsletter
- Review Go Figure with FRED

This blog explains everyday economics, consumer topics and the Fed. It also spotlights the people and programs that make the St. Louis Fed central to America’s economy. Views expressed are not necessarily those of the St. Louis Fed or Federal Reserve System.
Email Us
