


Small Business Lending Trends and Banking Deserts, 2019-23
Small businesses are a major contributor to the U.S. economy, as evidenced by a 2024 fact sheet from the Small Business Administration (PDF).
- Nearly 35 million small businesses employ 59 million people, who represent 46% of the nation’s workforce.
- In rural areas, small businesses account for over 54% of jobs.
- Small businesses contribute 44% of the country’s gross domestic product.See the SBA’s “Frequently Asked Questions about Small Business, 2024.”
Access to capital is crucial for these businesses, especially rural small businesses. Capital enables them to invest in equipment, expand operations, hire employees, and develop new products and services. Such opportunities for growth can benefit individual businesses as well as the economic resilience of local communities.
Considering banks’ role as primary capital providers and the importance of small businesses to rural communities, the decline in small business bank financing since 2019 warrants examination, including of geographical differences in lending.
According to the Federal Reserve’s Small Business Credit Survey (SBCS), banks remain the dominant source of funding for smaller firms,The 2023 SBCS revealed that small businesses most frequently turned toward traditional banking institutions for financing: 39% of small businesses seeking financing applied to small banks and 31% to large banks. Online lenders were the third most popular option, with 16% of small businesses that applied for financing going to them. which serve as economic anchors in rural communities. Building on previous research that physical distance between small businesses and bank branches affects lending outcomes, I extend the analytical framework to examine credit allocation patterns within banking desertsBanking deserts are places in which no physical bank or credit union branch exists. and nondeserts.
This blog post describes patterns in small business financing from 2019 to 2023, drawing on data from the Federal Financial Institutions Examination Council (FFIEC), the SBCS and the FedCommunities Banking Deserts Dashboard. The analysis describes:
- Overall demand for small business financing, particularly from banks
- Supply of small business bank loans nationally and in the Eighth Federal Reserve DistrictHeadquartered in St. Louis, the Fed’s Eighth District covers all of Arkansas, most of Missouri, and parts of Illinois, Indiana, Kentucky, Mississippi and Tennessee.
- Lending patterns in urban and rural communitiesFor this analysis, “urban” is defined as areas within a metropolitan statistical area (MSA) and “rural” is defined as areas outside an MSA.
- Impact of banking deserts on small business lending
Small Business Loan Demand and Supply
The SBCS reveals important trends in small business financing between 2019 and 2023.
- Overall demand for financing remained stable, with 37% of small businesses reporting they applied for loans, lines of credit and merchant cash advances both years.
- Among lender types, banks consistently served as the primary source of small business financing applications.
By 2023, however, a shift occurred in small business’ banking preferences for financing.
- Applications to large banks increased by 9 percentage points, while those to small banks decreased by 5 percentage points.Starting with its 2023 survey, the SBCS defines a large bank as one with $10 billion or more in assets and a small bank as having less than $10 billion in assets.
- This pattern was similar across urban and rural areas.
It’s important to note that 2019 and 2023 represent similar points in the business cycle, with the economy growing during both years. This suggests differences across the two years are structural in nature rather than due to changing economic conditions. Given stable overall demand, these findings underscore the enduring importance of bank financing for small businesses. They also indicate a growing preference for larger banking institutions, regardless of geographical location.
The St. Louis Fed’s Community Investment Explorer tool, which draws from FFIEC data, points to the importance of banks as a source of capital for small businesses.
- In 2023, the most recent year of available data from the FFIEC, banks made over $328 billion in loans to small businesses throughout the U.S. Of this total, Eighth District small businesses received more than $14 billion in loans.Author’s calculations of FFIEC CRA small business lending data, 2023.
- Despite increasing demand for small business loans from large banks, my analysis shows a decline in the supply of bank-provided capital. Nationally, between 2019 and 2023, bank lending by real dollar amount declined by 18%, while the Eighth District experienced a 12% decline. Lending declines by percentage were smaller in rural areas relative to urban areas for both the U.S. and the Eighth District. (See the figure below.)
Percent Change in Bank Small Business Lending, 2019-23
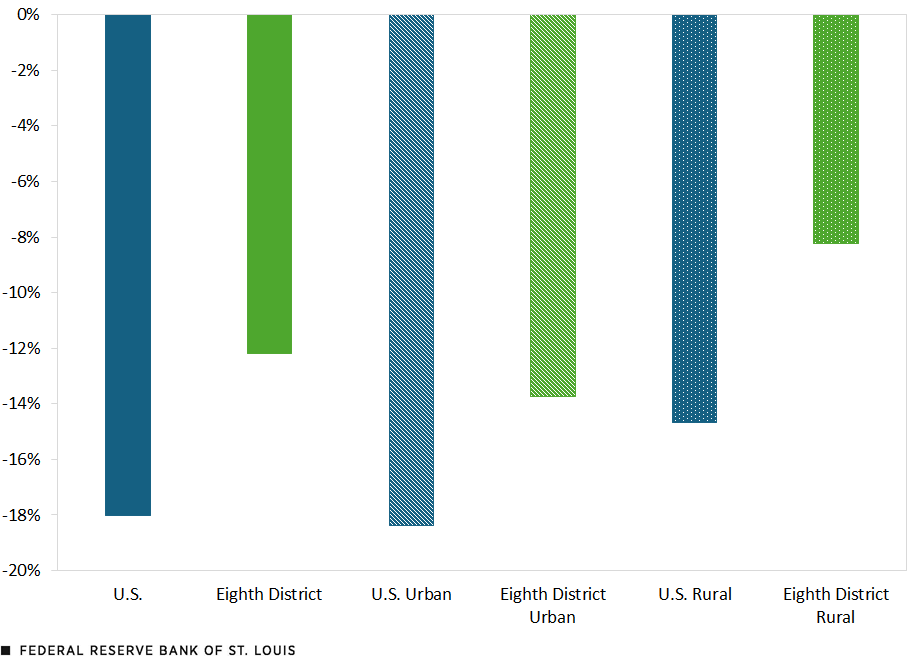
SOURCES: Author’s calculations of FFIEC CRA small business lending data.
NOTE: Urban areas are those within a metropolitan statistical area (MSA) and rural areas are those outside an MSA.
Responses from small businesses in the SBCS potentially explain the rural-urban difference. There were substantial differences in large banks’ approval rates for financing between urban and rural businesses between 2019 and 2023.
- Rural small businesses reported a 25 percentage point increase in approvals for loans, lines of credit and cash advances from large banks.
- In contrast, urban small businesses reported a 1 percentage point decline in approvals for the same financial products.See the findings from the 2023 SBCS.
More research is needed to understand the factors contributing to differing approval rates by bank size and the location of small businesses.
The Relationship between Banking Deserts and Bank Small Business Lending
In this section, I explore the extent to which new and persistent banking deserts affect small business loans made by banks.
FedCommunities’ Banking Deserts Dashboard defines a banking desert as a census tract lacking a physical bank branch within a specific geographic radius of its population center. This radius varies by area type: 2 miles for urban areas, 5 miles for suburban areas and 10 miles for rural areas.
To describe the relationship between banking deserts and bank small business lending, I combined data from the Banking Deserts Dashboard with the FFIEC data on small business lending. I consolidated urban and suburban tracts into a single “urban” category—using the same definitions as above for urban and rural—while maintaining the original desert classifications. My analysis focuses on four distinct groups of census tracts:
- Persistent nondeserts: areas with at least one bank branch from 2019 to 2023
- Persistent deserts: areas with no bank branch from 2019 to 2023
- New deserts: areas that lost all bank branches between 2020 and 2023
- New nondeserts: former deserts that gained at least one bank branch between 2020 and 2023
As previously noted, research shows that small businesses experience reduced credit availability as their distance from bank branches increases. I examined whether this same relationship exists for banking deserts. My analysis revealed some surprising patterns:
- Persistent deserts saw less of a decline in lending than nondeserts.
- Within persistent deserts, rural small businesses experienced a much steeper decline in lending, about two-and-a-half times greater than those in urban areas.
- Small businesses in new banking deserts experienced decreased lending. However, the decline was more pronounced for small businesses in rural areas than for those in urban areas.
Percent Change in Lending by Banking Desert Status, 2019-23
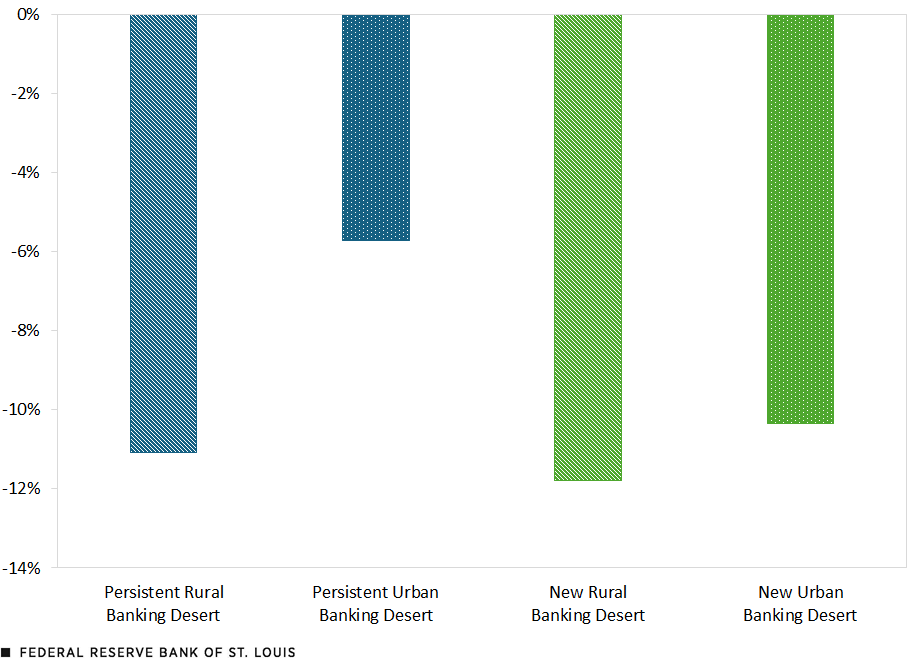
SOURCES: Author’s calculations of FFIEC small business lending data and FedCommunities’ Banking Deserts Dashboard.
NOTE: Urban areas are those within a metropolitan statistical area (MSA) and rural areas are those outside an MSA.
Summary and Conclusion
Despite increasing demand for financing from large banks, overall bank lending to small businesses declined both nationally and in the Fed’s Eighth District between 2019 and 2023, with urban areas experiencing sharper declines than rural areas. However, as it relates to banking deserts, rural communities experienced steeper declines in both new and persistent banking deserts. Counterintuitively, small business lending declined less in persistent deserts than in nondeserts. These findings highlight the need to better understand the factors driving supply and demand for small business capital, specifically in rural areas and within the context of banking deserts.
Notes
- See the SBA’s “Frequently Asked Questions about Small Business, 2024.”
- The 2023 SBCS revealed that small businesses most frequently turned toward traditional banking institutions for financing: 39% of small businesses seeking financing applied to small banks and 31% to large banks. Online lenders were the third most popular option, with 16% of small businesses that applied for financing going to them.
- Banking deserts are places in which no physical bank or credit union branch exists.
- Headquartered in St. Louis, the Fed’s Eighth District covers all of Arkansas, most of Missouri, and parts of Illinois, Indiana, Kentucky, Mississippi and Tennessee.
- For this analysis, “urban” is defined as areas within a metropolitan statistical area (MSA) and “rural” is defined as areas outside an MSA.
- Starting with its 2023 survey, the SBCS defines a large bank as one with $10 billion or more in assets and a small bank as having less than $10 billion in assets.
- Author’s calculations of FFIEC CRA small business lending data, 2023.
- See the findings from the 2023 SBCS.

Citation
Michael Eggleston, ldquoSmall Business Lending Trends and Banking Deserts, 2019-23,rdquo St. Louis Fed On the Economy, Sept. 23, 2025.
This blog offers commentary, analysis and data from our economists and experts. Views expressed are not necessarily those of the St. Louis Fed or Federal Reserve System.
Email Us
All other blog-related questions