


Understanding the “Swoosh”-Shaped Yield Curve for Treasuries
This post analyzes the current yields on U.S. Treasuries at different horizons and their possible implications. Currently, the shape of the yield curve exhibits a distinctive “swoosh” pattern, characterized by an initial decline in shorter-term rates (maturities of two years or less) followed by a subsequent increase in longer-term rates. (See the figure below.) This pattern occurs for both nominal and real interest rates.For nominal rates, we use data from Bloomberg’s U.S. Treasury Actives Curve. For real rates, we use the U.S. Treasury Inflation Indexed Curve, which is based on Treasury inflation-protected securities. Both curves are for Sept. 24, 2025.
After slipping in the first two years, the trajectory of interest rates shifts, commencing an upward trend as maturity extends. By the five-year maturity, the real interest rate aligns with the one-year yield, standing at 1.1%. At the long end of the maturity, we observe a gradual escalation in real interest rates.
Instead of an upward-sloping curve (a “normal” yield curve), the figure shows a divergence between short-term and long-term rates, highlighting the distinctive swoosh pattern across the maturity spectrum.
Yield Curve for U.S. Treasuries
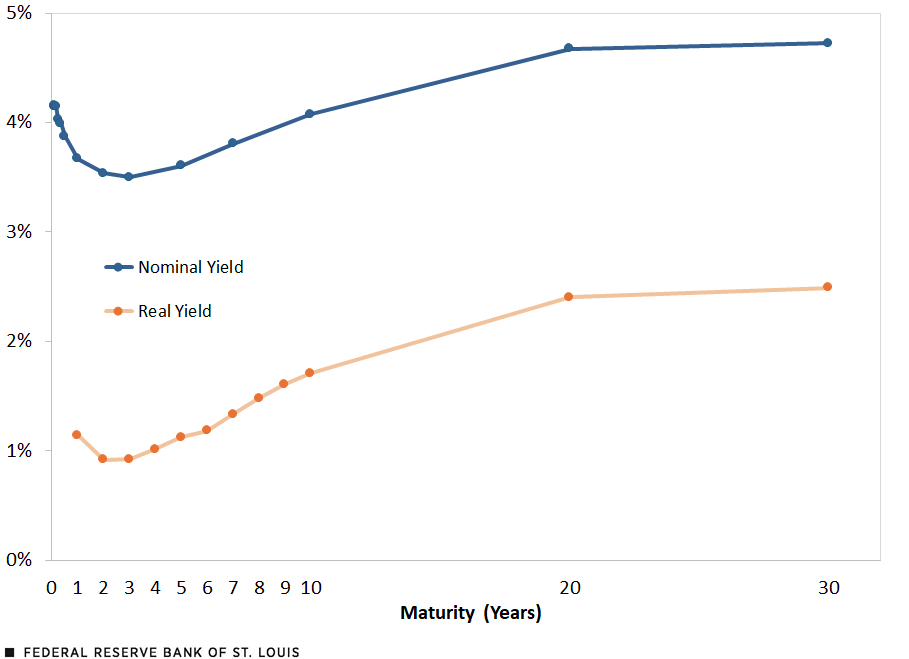
SOURCE: Bloomberg.
NOTES: Real yields are based on Treasury inflation-protected securities. Data retrieved on Sept. 9, 2025.
Although the yield curve provides valuable insights into interest rates at various maturities, it represents only a snapshot for a single day, Sept. 9, 2025, in this case. In the subsequent analysis, we examine how various real rates have evolved over the past six years.
Real Rates during Tightening and Easing Cycles
We continue our analysis by examining the time series of real interest rates across various maturities. The next figure presents the one-year, five-year, and 10-year real rates, alongside the effective federal funds rate (a benchmark short-term nominal interest rate set by the Federal Reserve). The illustration contains two distinct shaded regions: the first represents the monetary tightening cycle that occurred between March 2022 and July 2023. During this period, the Federal Reserve increased the target for the federal funds rate. The second period indicates the monetary easing cycle that commenced in September 2024, when the Federal Reserve started to cut the fed funds rate target.
Effective Federal Funds Rate and Real Rates for Treasuries since 2019
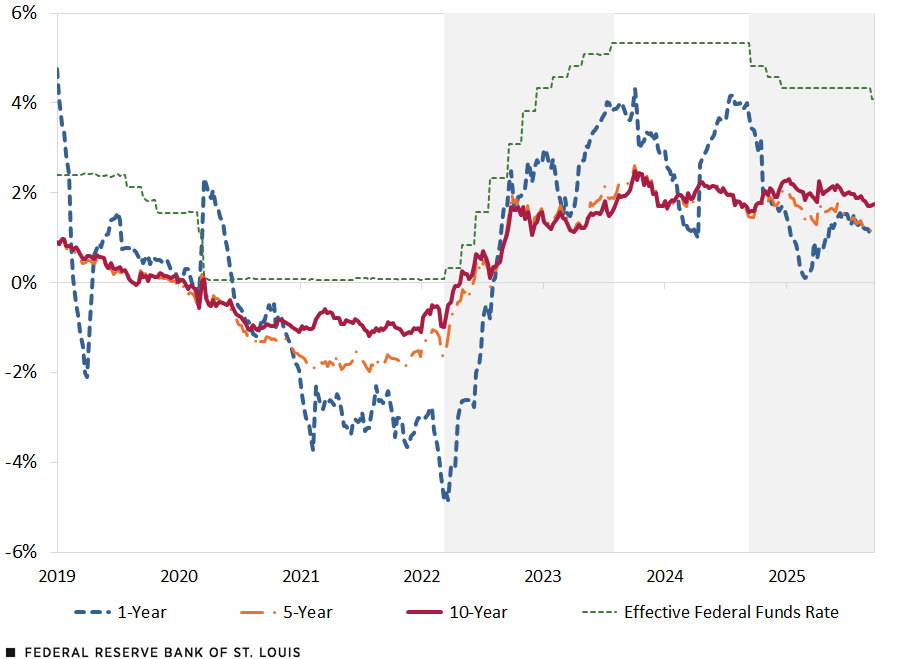
SOURCES: Bloomberg and FRED (Federal Reserve Economic Data).
NOTES: Weekly data based on Treasury inflation-protected securities. Data retrieved on Sept. 24, 2025.
During the 2022-23 tightening cycle, the fed funds rate experienced a significant increase. The Federal Reserve made four 75 basis point increases, two 50 basis point increases, and five 25 basis point increases, for a total increase of 525 basis points. The effective fed funds rate increased from 0.08% to 5.33% during this time. Correspondingly, the one-year, five-year, and 10-year real rates increased by 7.4, 3.0, and 2.1 percentage points, respectively.To compute the changes for the tightening cycle, we compare the median value in July 2023 with the median value in February 2022, the month before the first rate hike. For the easing cycle, we compare the median value in September 2025 with the median value in September 2024. This pattern indicates that both short-term and long-term rates responded to the monetary policy tightening. While the entire yield curve moved upward, the short-term rate exhibited greater sensitivity to these policy adjustments.
In the current monetary easing cycle, the response of real rates exhibits a different pattern. The Federal Reserve made one 50 basis point cut, and three 25 basis point cuts, for a total of 1.25 percentage points (the effective fed funds rate decreased from 5.33% to 4.09%). While the one-year real rate has declined by 2.4 percentage points, the response of longer-term rates has been notably muted. The five-year rate has decreased by only 0.30 percentage points, whereas the 10-year rate has increased by 0.10 percentage points. This divergence in rate movements across the yield curve presents an interesting contrast to the previous tightening cycle.
Overall, we find that long-term rates moved higher with rising short-term rates during the 2022-23 tightening cycle but showed minimal change in the current easing cycle.
Decoupling of Forward Real Rates
Next, we examine the evolution of expected future short-term rates. Specifically, we focus on the one-year real rate, five and 10 years forward.The AyBy rate represents the expected B-year interest rate beginning A years from now. The equation is: These forward rates provide significant insights into market expectations regarding future monetary policy and economic conditions. As explained in Julian Kozlowski and Samuel Jordan-Wood’s January 2023 blog, “The Many Interest Rates in 2022,” these forward rates can be calculated using current spot rates across different maturities.
Many market participants and policymakers regard these rates as valuable indicators of the long-run neutral rate, the rate at which monetary policy is neither expansionary nor contractionary. These measures have two key characteristics. First, we consider the one-year rate, which functions as a metric for the short-term rate. Second, we examine this rate in the relatively distant future: five and 10 years ahead. Looking at these rates in the future allows us to abstract from short-term fluctuations and current policy influences, providing a clearer view of long-term economic expectations.
The next figure tracks the evolution of forward real interest rates by plotting the five-year, one-year forward rate (5y1y) and the 10-year, one-year forward rate (10y1y).Derived from Bloomberg’s U.S. Treasury Inflation Indexed Curve. The data’s frequency is daily, and the last update was Sept. 24, 2025.
The Evolution of Forward Real Interest Rates
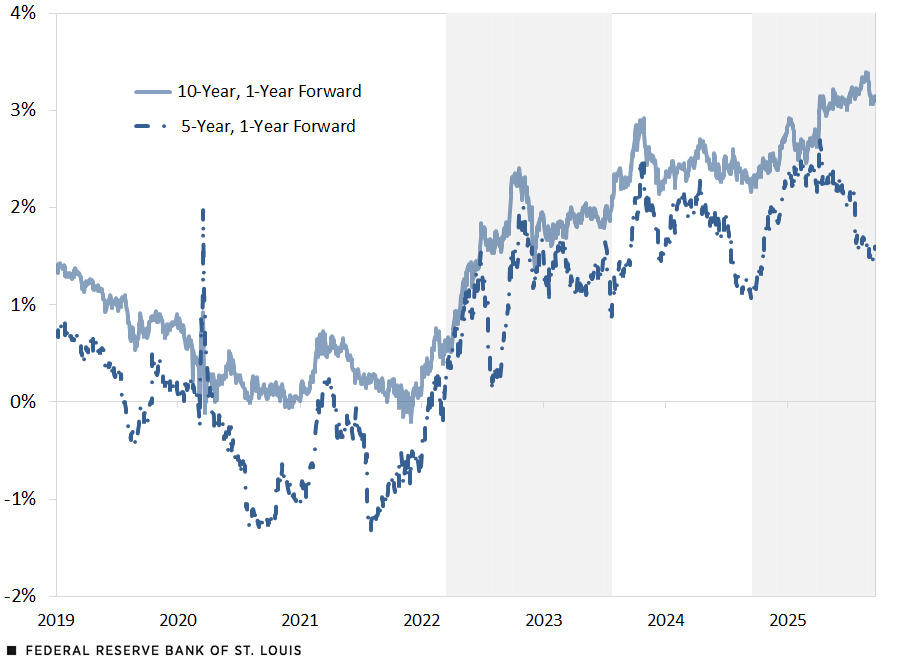
SOURCES: Bloomberg and authors’ calculations.
NOTES: Daily data based on Treasury inflation-protected securities. Data retrieved on Sept. 24, 2025.
This figure reveals a notable decoupling between medium- and long-term forward rates that has emerged recently. While the 5y1y rate and 10y1y rate historically moved in tandem, they have diverged significantly in recent months. During this calendar year alone, the 5y1y rate has decreased by 80 basis points, indicating market expectations for lower interest rates in the medium term. In contrast, the 10y1y rate has increased by 40 basis points, suggesting that markets anticipate higher rates in the longer term.
By calculating the spread between the one-year rate 10 years from now (10y1y) and the one-year rate five years from now (5y1y), we can quantify this divergence. This differential has widened considerably, currently trading at 152 basis points. This substantial gap reinforces the market’s expectation of a steepening yield curve over the medium to long term and provides compelling evidence that market participants anticipate short-term rates will increase significantly between years five and 10. These pricing dynamics offer valuable insights into the financial market’s expected trajectory of monetary policy beyond the immediate horizon.
Term Premium
Next, we examine the term premium by establishing two distinct metrics. First, we define the “current term premium” as the differential between the five-year and one-year real rates. Second, we introduce the “forward term premium,” which represents the difference between the five-year real rate five years forward (5y5y) and the one-year real rate five years forward (5y1y).Term Premiums of Real Interest Rates: Current vs. Forward
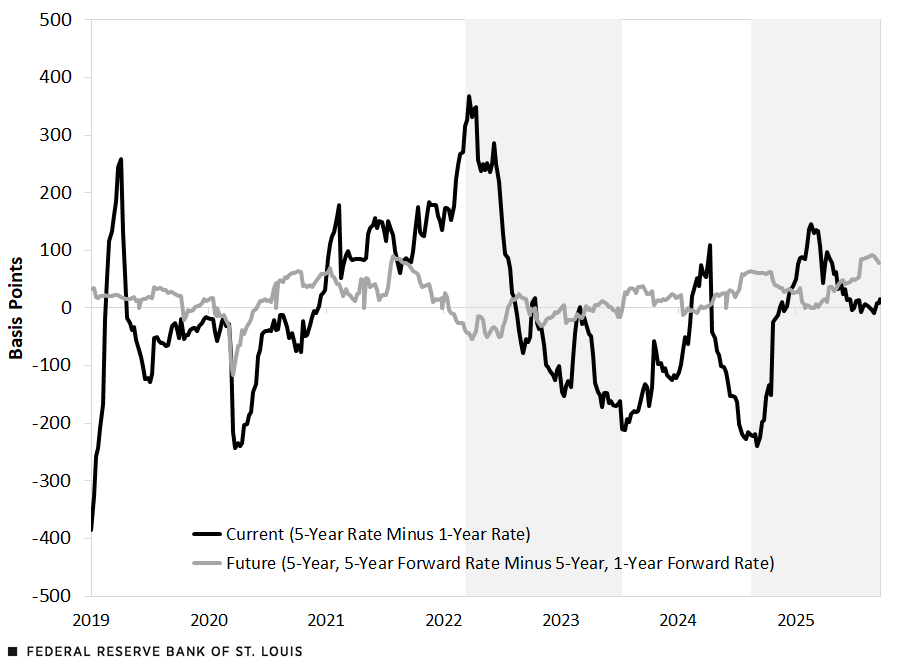
SOURCE: Authors’ calculations.
NOTE: Data retrieved on Sept. 24, 2025.
The current term premium exhibits greater volatility than the forward term premium. Presently, the current term premium approaches zero, indicating that the one-year and five-year real rates are trading at equivalent levels. As demonstrated in the current yield curve (first figure), while short-term rates are declining, by year five they have already recovered to match the one-year real rate level. It is important to observe that the term premium displays considerable volatility and has decreased from 50 basis points to 9 basis points in 2025.
The forward term premium, in contrast, remains positive and shows an upward trajectory. It currently stands at 79 basis points. This further substantiates the expectation that future rates will increase in the long term, consistent with our earlier observations.
Conclusion
The current yield curve and its historical evolution provide valuable insights into the dynamics of interest rates at different horizons. The distinctive “swoosh” pattern observed in the yield curve, along with the decoupling of forward rates and the behavior of the term premium, highlights the complex interplay between short-term and long-term interest rates. We conclude that while short-term rates are declining, long-term rates are increasing. This interest rate behavior may be signaling an expectation of future fiscal deficits and large debt-to-gross domestic product ratios, which would result in higher interest rates.
Notes
- For nominal rates, we use data from Bloomberg’s U.S. Treasury Actives Curve. For real rates, we use the U.S. Treasury Inflation Indexed Curve, which is based on Treasury inflation-protected securities. Both curves are for Sept. 24, 2025.
- To compute the changes for the tightening cycle, we compare the median value in July 2023 with the median value in February 2022, the month before the first rate hike. For the easing cycle, we compare the median value in September 2025 with the median value in September 2024.
- The AyBy rate represents the expected B-year interest rate beginning A years from now. The equation is: These forward rates provide significant insights into market expectations regarding future monetary policy and economic conditions. As explained in Julian Kozlowski and Samuel Jordan-Wood’s January 2023 blog, “The Many Interest Rates in 2022,” these forward rates can be calculated using current spot rates across different maturities.
- Derived from Bloomberg’s U.S. Treasury Inflation Indexed Curve. The data’s frequency is daily, and the last update was Sept. 24, 2025.


Citation
Julian Kozlowski and Nicholas Sullivan, ldquoUnderstanding the “Swoosh”-Shaped Yield Curve for Treasuries,rdquo St. Louis Fed On the Economy, Oct. 9, 2025.
This blog offers commentary, analysis and data from our economists and experts. Views expressed are not necessarily those of the St. Louis Fed or Federal Reserve System.
Email Us
All other blog-related questions