


The Many Interest Rates in 2022
Throughout 2022, the Federal Open Market Committee (FOMC) raised the federal funds rate target range from 0%-0.25% to 4.25%-4.5%. This blog post analyzes the response of nominal and real rates at different maturities.
The first figure below shows that although the fed funds rate started to lift off in March 2022, the nominal one-year rate on U.S. Treasuries began to increase in November 2021. In March 2022, the rate on the one-year U.S. Treasury was already at 1.25%. One interpretation is that the market started to price in expected fed funds rate hikes.
Next, we evaluate the behavior of long-term nominal rates. In particular, we look at the five-year, five-year forward rate. This rate informs us about the expectation for the five-year rate five years from today.
To compute the five-year, five-year forward rate, we first take the ratio of the accumulated return of the 10-year rate over the accumulated return of the 5-year rate and then calculate the annual rate of this ratio (i.e., we take the fifth root of the ratio). The full equation is:
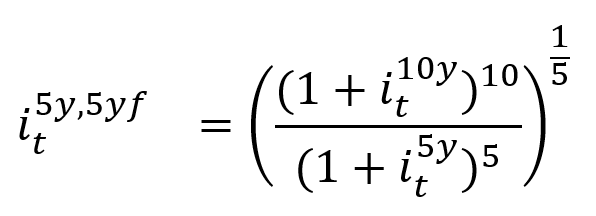
We use the 10-year and five-year constant maturity Treasury rates for the relevant interest rates. Thus, we have nominal rates for both short and long maturities. In the first figure, we compare the nominal one-year and nominal five-year, five-year forward rates.
Nominal Short- and Long-Term Interest Rates
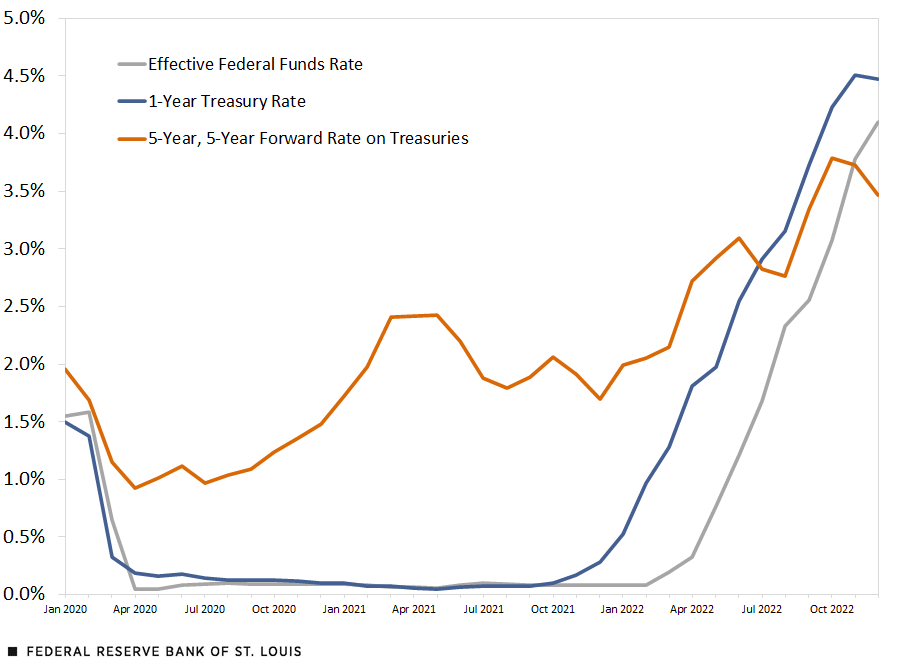
SOURCES: Board of Governors (data retrieved via FRED); and authors’ calculations.
NOTES: Data are monthly averages from January 2020 to December 2022.
For the majority of 2020 and 2021, the long-term rate was between 1% and 2% higher than the short-term rate. However, in 2022, as the FOMC started to raise the federal funds rate, there was a compression between the two rates, with the short-term rate increasing much faster than the long-term rate. By July 2022, the nominal short rate had surpassed the nominal long rate—resulting in what is called a yield curve inversion.
A Look at the Path of Real Rates
To consider the effect of inflation, however, we should consider real rates. We define the real interest rate as the difference between the nominal interest in a certain period with a specific maturity and the expected inflation rate in that same period with the equivalent maturity . The full equation is:

Once again, we define the one-year as the short rate and the five-year, five-year forward as the long rate. To calculate the five-year, five-year forward inflation rate , we take a similar approach to our previous equation for the five-year, five-year forward interest rate. We first take the ratio of the accumulated expected inflation in 10 years over the accumulated expected inflation in five years, and then calculate the annual change of this ratio.
Measuring expected inflation is complex, and there are many measures available. We use the Federal Reserve Bank of Cleveland expected-inflation data. These estimates are calculated with a model that uses Treasury yields, inflation data, inflation swaps and survey-based measures of inflation expectations. Notably, the expected inflation in these data is similar to that in other measures, such as TIPS implied inflation and the Blue Chip survey. TIPS, or Treasury inflation-protected securities, can be used to calculate expected inflation by comparing the inflation protected securities with nominal securities with similar maturities. The Blue Chip surveys business economists on their expectations for macroeconomic variables, including inflation.See Julie Bennett and Michael T. Owyang’s 2022 Review article for a more in depth discussion of inflation forecasts.
The second figure plots the real rates.
Real Short- and Long-Term Interest Rates
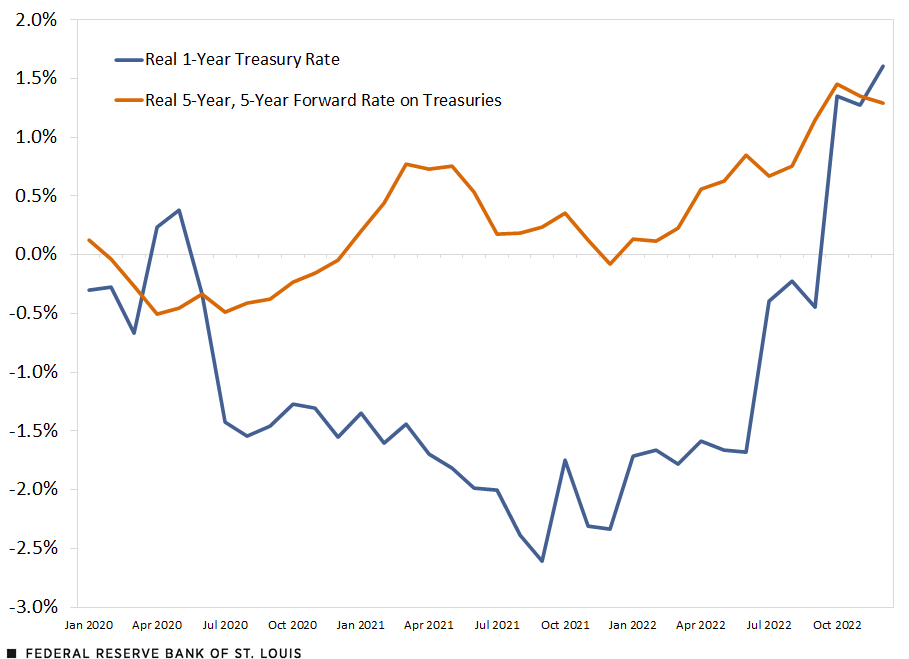
SOURCES: Board of Governors and Federal Reserve Bank of Cleveland (data from both sources retrieved via FRED); and authors’ calculations.
NOTES: Data are monthly averages from January 2020 to December 2022. The real rate is calculated as nominal minus expected inflation.
During the first two months of the COVID-19 pandemic, there was a brief inversion of the real yield curve. For most of 2020 and 2021, however, the real long-term rate was between 1% and 2% higher than the real short-term rate–the same as with the nominal rates. In 2022, we again see the compression between the short rate and the long rate, as the short rate narrows the gap with the long rate, particularly in October and November. In December 2022, we finally see the real yield curve invert. That is, the real short rate is higher than the real long rate, albeit by a small amount.
Note
- See Julie Bennett and Michael T. Owyang’s 2022 Review article for a more in depth discussion of inflation forecasts.


Citation
Julian Kozlowski and Samuel Jordan-Wood, ldquoThe Many Interest Rates in 2022,rdquo St. Louis Fed On the Economy, Jan. 12, 2023.
This blog offers commentary, analysis and data from our economists and experts. Views expressed are not necessarily those of the St. Louis Fed or Federal Reserve System.
Email Us
All other blog-related questions