


Are U.S. Treasuries Still “Convenient”?
Traditionally, the convenience yield of U.S. Treasuries reflects the extra value investors place on Treasuries beyond the present value of the securities’ cash flows: It reflects the value of the liquidity and safety provided by the Treasuries. The convenience yield lowers the interest payments on government debt, which is a source of seigniorage.
In this blog post, we cover three measures of the convenience yield: the AAA-UST spread, the swap spreads and the box spreads. All three measures show a noticeable reduction in the convenience yield in recent years, which is more pronounced for long-maturity spreads.
Decline in the AAA-UST Spread in Recent Years
The first figure illustrates the AAA-UST spread over time, which represents the difference between the highest-rated corporate bonds (AAA) and U.S. Treasury bonds (UST). This spread reflects the premium associated with Treasury bonds relative to corporate bonds. Specifically, we employ the option-adjusted spread of the ICE BofA AAA U.S. Corporate Index as our metric. The figure presents this spread from 2019 to the present.
Options-Adjusted Spread of the ICE BofA AAA U.S. Corporate Index
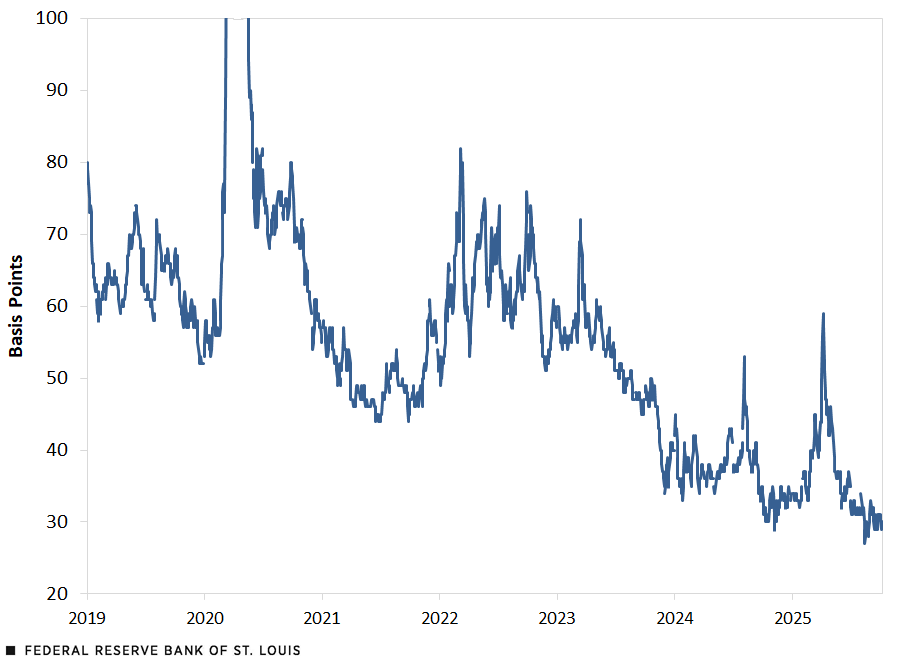
SOURCE: FRED®.
NOTES: Data retrieved on Oct. 9, 2025. To make the downward trend more visible, the figure doesn’t display data from March 9, 2020, to May 18, 2020; the spread reached as high as 235 basis points on March 20, 2020.
The AAA-UST spread has been declining, reaching 30 basis points on Oct. 8, 2025. Notably, the average spread from 2012 to 2019 was 67 basis points, whereas in 2025, the average contracted by nearly half, to 36 basis points. This narrowing of the spread is significant, as AAA-rated corporate bonds have historically offered less liquidity and safety compared with Treasury bonds. As explained by Arvind Krishnamurthy and Annette Vissing-Jorgensen in 2012, this phenomenon can be attributed to an increase in the supply of Treasuries, driven by the rising debt-to-gross domestic product ratio.See Arvind Krishnamurthy and Annette Vissing-Jorgensen’s 2012 article, “The Aggregate Demand for Treasury Debt,” In the Journal of Political Economy.
Swap Spreads Are Compressed, Especially for Longer Tenors
Another metric used to gauge convenience yield is the swap spread, which represents the difference between maturity-matched swap rates and Treasury yields. This measure has been employed this year by researchers such as Zhengyang Jiang, Robert J. Richmond and Tony Zhang,See Zhengyang Jiang, Robert J. Richmond and Tony Zhang’s 2025 National Bureau of Economic Research working paper, “Convenience Lost.” and Karlye Dilts Stedman and Andrew Hanson.See Karlye Dilts Stedman and Andrew Hanson’s 2025 Kansas City Fed working paper, “Unconventional Monetary Policy Spillovers and the (In)convenience of Treasuries.”
In this blog post, we build upon the work of Jiang and his co-authors and compute the swap spreads at various maturities, as illustrated in the figure below.The spreads are based on LIBOR and SOFR swap rates, retrieved from Bloomberg. The swap rate is the rate that makes the present value of the fixed leg equal to the present value of the floating leg at initiation of the swap. The figure displays the swap spreads for one year (blue), five years (dotted orange) and 10 years (red). A notable feature of the data is the significant decline in swap spreads, particularly for longer maturities. This decline is consistent with the findings of Jiang, Richmond and Zhang in their “Convenience Lost” working paper, which examines the decline in convenience yields across various markets.
Swap Spreads between Maturity-Matched Swap Rates and Treasury Yields
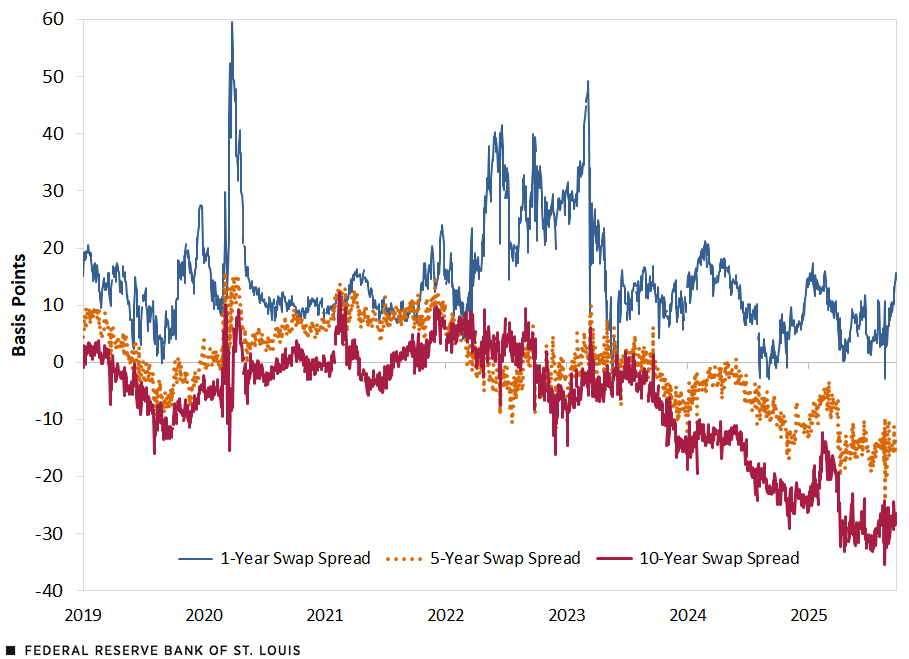
SOURCE: Bloomberg.
NOTE: Daily data retrieved on Sept. 24, 2025.
Between 2012 and 2019, the one-year swap spread averaged 22 basis points, while the five-year and 10-year swap spreads averaged 9 and 2 basis points, respectively. By 2025, these swap spreads had declined significantly, with the one-year swap rate falling to 8 basis points, the five-year rate falling to -12 basis points, and the 10-year rate falling to -26 basis points.
Box Spreads Are Also Narrowing
The third measure that we examine is the box spread. Building upon the 2022 work of Jules H. van Binsbergen, William F. Diamond and Marco Grotteria,See Jules H. van Binsbergen, William F. Diamond and Marco Grotteria’s 2022 article, “Risk-Free Interest Rates,” in the Journal of Financial Economics. we recover the implied risk-free interest rate embedded in options data. Specifically, we estimate the implicit risk-free rate used to price call and put options on the S&P 500, retrieved from Cboe Global Markets between January 2012 and September 2025. Next, we can compute the spread of this risk-free rate with Treasuries to get a measure of the convenience yield.
The starting point is the put-call parity for European options:
Where and represent the put and call prices at time t, for a time-to-maturity T and strike price indexed by i; represents the present discounted value of the cash-flows generated by the underlying asset; is the current price of the underlying asset; is the discount rate; is the strike price.
For a given time t and maturity T, we can estimate the following regression:
Since , then we can recover the risk-free rate at each t and T by calculating .
We follow van Binsbergen, Diamond and Grotteria’s method and do this estimation at the minute level for maturities of six, 12 and 18 months. To convert to daily frequency, we take the median over the minute-level estimates. Finally, we take the spread by comparing them with corresponding yields on government bonds.
The figure plots the box spread at six months (gray), 12 months (dotted red) and 18 months (green).
Box Spreads
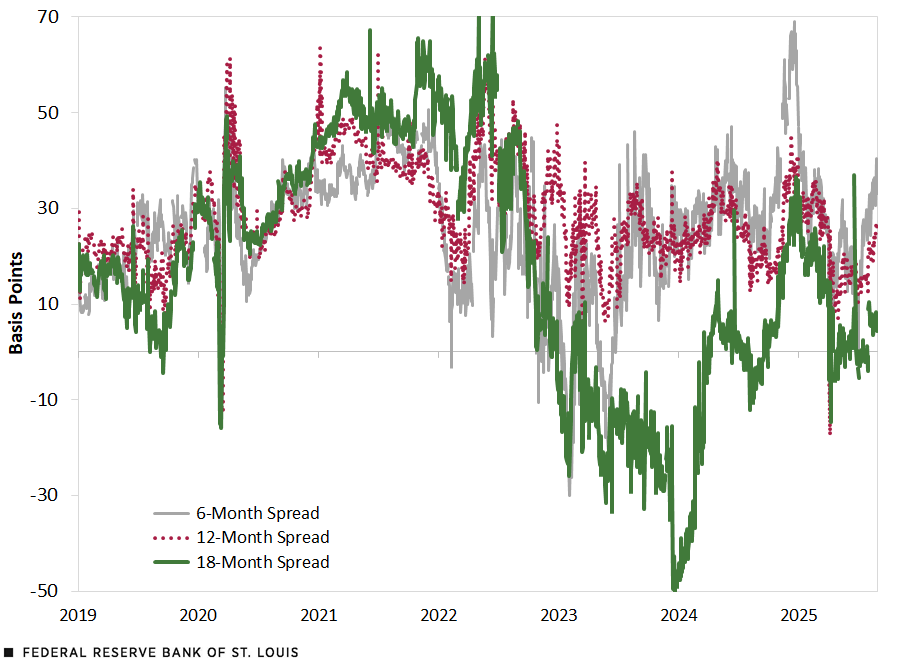
SOURCES: Van Binsbergen, Diamond and Grotteria (2022), Cboe Global Markets and authors’ calculations.
NOTE: Last observation on Aug. 29, 2025.
To make the trend clearer, the table shows all the different convenience yield measures (AAA-UST spread, swap spread, and box spread) yearly averages. Both the figures and the table show an overall decrease in the convenience yield; the longer maturity spreads have especially decreased. The average box spread in 2012-19 for the 18-month spread was 34, which has now fallen to 9 in 2025. As shown in the table, the averages for the AAA-UST spread and the swap spreads have also declined.
| Year | AAA-UST | 1-Year Swap Spread | 5-Year Swap Spread | 10-Year Swap Spread | 6-Month Box Spread | 12-Month Box Spread | 18-Month Box Spread |
|---|---|---|---|---|---|---|---|
| 2012-19 | 67 | 22 | 9 | 2 | 31 | 31 | 34 |
| 2020 | 79 | 15 | 5 | -1 | 28 | 30 | 30 |
| 2021 | 50 | 12 | 9 | 1 | 40 | 41 | 51 |
| 2022 | 63 | 24 | 0 | 1 | 21 | 35 | 36 |
| 2023 | 51 | 16 | -1 | -6 | 13 | 23 | -17 |
| 2024 | 37 | 10 | -6 | -18 | 34 | 26 | -2 |
| 2025 | 36 | 8 | -13 | -26 | 26 | 21 | 9 |
| SOURCE: Authors’ calculations. | |||||||
| NOTE: All values are in basis points. | |||||||
Conclusion
The reduction in the convenience yield of U.S. Treasury securities, particularly for long-maturity spreads, has been notable. Specifically, the AAA-UST spread has decreased from 67 to 36 basis points. Additionally, the 10-year swap spread has shifted from 2 to -26 basis points, and the 18-month box spread has contracted from 34 to 9 basis points. These changes appear consistent with the current environment of elevated fiscal deficits and increased government debt. Such conditions typically reduce the convenience yield and contribute to higher long-term yields. For an analysis of U.S. Treasury yields, see our previous blog post.
The authors thank Karlye Dilts Stedman for help with the swap data, and William Diamond for sharing his code and assisting with the box spread data.
Notes
- See Arvind Krishnamurthy and Annette Vissing-Jorgensen’s 2012 article, “The Aggregate Demand for Treasury Debt,” In the Journal of Political Economy.
- See Zhengyang Jiang, Robert J. Richmond and Tony Zhang’s 2025 National Bureau of Economic Research working paper, “Convenience Lost.”
- See Karlye Dilts Stedman and Andrew Hanson’s 2025 Kansas City Fed working paper, “Unconventional Monetary Policy Spillovers and the (In)convenience of Treasuries.”
- The spreads are based on LIBOR and SOFR swap rates, retrieved from Bloomberg. The swap rate is the rate that makes the present value of the fixed leg equal to the present value of the floating leg at initiation of the swap.
- See Jules H. van Binsbergen, William F. Diamond and Marco Grotteria’s 2022 article, “Risk-Free Interest Rates,” in the Journal of Financial Economics.


Citation
Julian Kozlowski and Nicholas Sullivan, ldquoAre U.S. Treasuries Still “Convenient”?,rdquo St. Louis Fed On the Economy, Oct. 14, 2025.
This blog offers commentary, analysis and data from our economists and experts. Views expressed are not necessarily those of the St. Louis Fed or Federal Reserve System.
Email Us
All other blog-related questions