


Exploring Trends in Community Development Consumer Lending
Community Development Financial Institutions (CDFIs) are banks, credit unions, loan funds and venture capital firms that specialize in delivering affordable financial services and products to low- and moderate-income (LMI) communities and underserved populations. Regardless of their structure, CDFIs are mission driven and serve small businesses, real estate developers and individuals that traditional financial institutions often don’t reach.
As a result, they are positioned to leverage a deep knowledge of their communities and tailor financial solutions to support community and economic development at the local level. Examining lending trends among CDFIs can help us better understand their role in access to credit—a critical component of a healthy and resilient economy.
Consumer Lending Accounts for the Biggest Portion of CDFI Financing
The CDFI Fund, part of the U.S. Department of the Treasury, provides detailed data on CDFI loans and investments. Using the most recent Consumer Loan Reports and Transaction Level ReportsThese reports represent a sample of all CDFI lending and investing activity, as only CDFIs that receive a grant from the CDFI Fund are required to report their loans and investments. As such, the composition of the sample can change over time, which may affect funding trends observed. from 2018 to 2022, this analysis highlights the role that consumer lendingAccording to the CDFI Fund’s definition (PDF), a consumer loan made by a CDFI is one in which a personal, secured or unsecured loan is extended to one or more individuals for specific purposes such as health, education, emergencies, credit repair, debt consolidation or other consumer-related needs. Notably, this definition excludes personal loans made for business purposes, as well as loans intended for home improvement or home repair. plays at CDFIs across the Eighth Federal Reserve District (PDF) and the U.S.
As previously noted, CDFIs provide financing for various purposes, such as supporting small businesses, financing real estate development, making consumer loans, and more. Consumer lending comprises the largest portion of CDFI financing over this period, accounting for 35% of the $254 billion in total CDFI financing by dollar amount, and an even larger 88% of the nearly 20,000 total number of loans made.CDFI Consumer Loan Reports and Transaction Level Reports, 2018-22. (See the first figure.)
CDFI Loans and Investments by Business Line, 2018-22
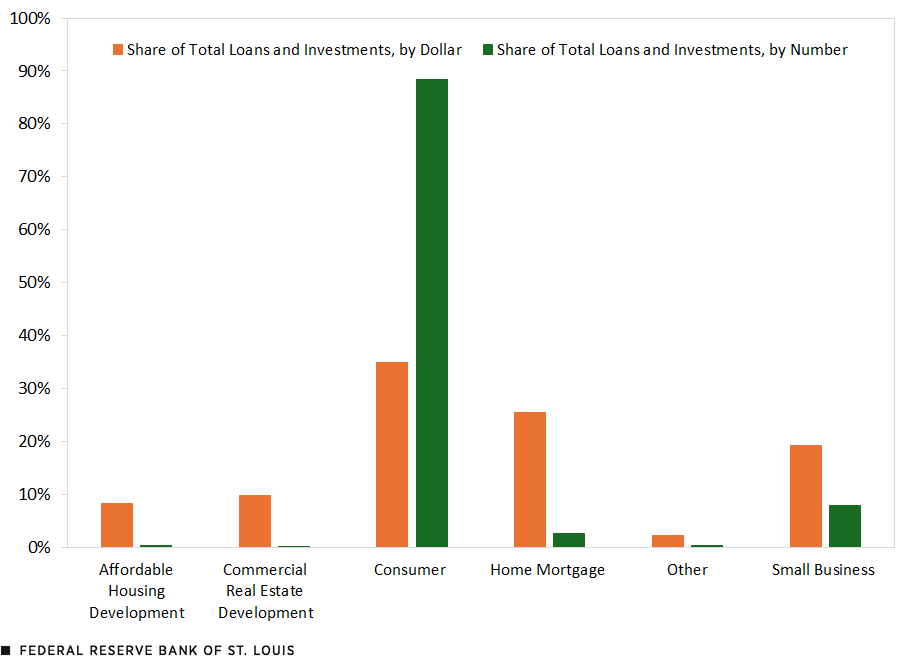
SOURCES: CDFI Fund Transaction Level Reports and Consumer Loan Reports 2018-22 and author’s calculations.
CDFI credit unions are the dominant source of consumer loans among CDFI institutions. In 2022, 42 CDFI credit unions originated over 675,000 consumer loans totaling nearly $10.7 billion. In contrast, consumer lending played a much smaller role for CDFI banks and loan funds. Thirty-nine CDFI loan funds originated 11,000 consumer loans valued at $38 million, while 11 CDFI banks originated 14,000 consumer loans worth $208 million.Author’s calculation based on 2018-22 CDFI Fund Consumer Loan Reports obtained via a nondisclosure agreement.
Demand for CDFI Consumer Loans Increased
Since 2019, the Federal Reserve has surveyed CDFIs to better understand the conditions and trends impacting these organizations. In the 2023 survey, the most recent, 74% of CDFIs whose primary line of business is consumer lending reported demand for their products had increased during the preceding 12 months. At a rate double that of all other CDFIs (32% compared with 16%), these CDFIs noted that their ability to meet demand was hampered by borrower qualifications. Two reasons for this difference are borrowers’ credit reports and loan affordability/rising interest rates.Author’s calculations of data from the Federal Reserve 2023 CDFI Survey.
- 74% of primarily consumer-lending CDFIs reported that borrowers’ credit report challenges limited their ability to meet demand, compared with 66% of all other CDFIs.
- 75% of primarily consumer-lending CDFIs reported that loan affordability/rising interest rates limited their ability to meet demand, compared with 66% of all other CDFIs.
CDFI Consumer Lending Trends in the Eighth District and Nationally Diverged
Trends in consumer lending differed for the Eighth District and the U.S. between 2018 and 2022.
- While lending volume by dollar amount rose for both the Eighth District and nationally (by approximately 138%), the Eighth District experienced a 208% increase in the number of loans whereas the U.S. saw a 27% decline.
- The average loan size in the Eighth District was more than twice the national average: $11,400 compared with $5,100.Median amounts cannot be calculated because the source data only provides total amount and total number of loans.
- In contrast to the national trend of consumer lending being concentrated in urban areas, the Eighth District’s funding-to-population ratiosThe funding-to-population ratio for metro areas of the U.S. and the Eighth District, for example, is calculated by dividing the percentage of funding that goes to a geography’s metropolitan areas by the percentage of the population living in those areas. This accounts not only for differences in funding amounts, but also for differences in the demographic composition of metro areas. A value of 1 indicates the share of funding is representative of the population. The same methodology is applied to micropolitan areas, rural areas, and low- and moderate-income areas. indicated a more balanced distribution of CDFI consumer lending across metropolitan, micropolitan and rural areas.According to Office of Management and Budget definitions, metropolitan statistical areas include at least one urbanized area of 50,000 or more inhabitants and micropolitan statistical areas include at least one urban cluster of at least 10,000 but fewer than 50,000 people. (See the second figure.)
Funding-to-Population Ratios by Geography Types
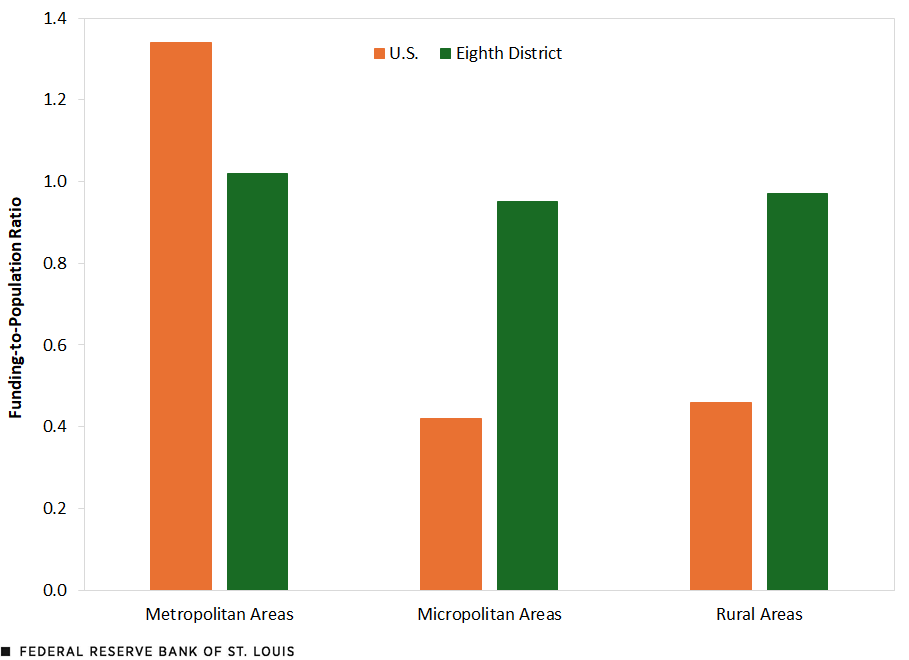
SOURCES: CDFI Fund Transaction Level Reports and Consumer Loan Reports 2018-22, U.S. Census Bureau American Community Survey Five-Year Estimate 2018-22, and author’s calculations.
NOTES: Funding-to-population ratios are calculated by dividing the percentage of funding that goes to the areas by the percentage of the population living in those areas. A value above 1 means funding is overrepresented relative to the area population, while a value below 1 signifies funding is underrepresented.
In addition, based on population distributions, CDFI consumer lending was concentrated more in middle- and upper-income areas nationally, but more evenly dispersed across Eighth District communities based on their income. (See the third figure.)
Funding-to-Population Ratio by LMI Communities
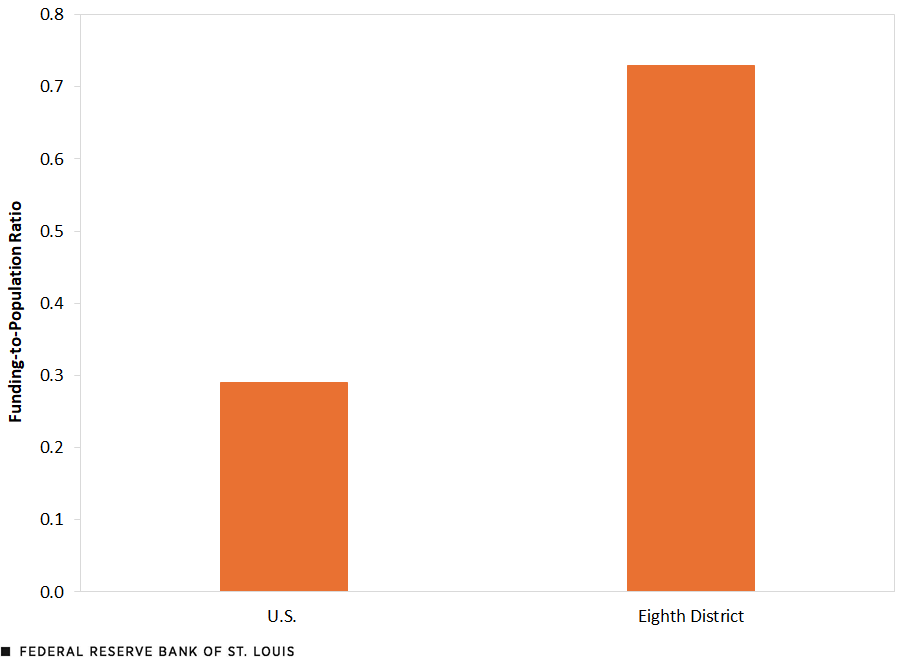
SOURCES: CDFI Fund Transaction Level Reports and Consumer Loan Reports 2018-22, U.S. Census Bureau American Community Survey Five-Year Estimate 2018-22, and author’s calculations.
NOTES: Funding-to-population ratios are calculated by dividing the percentage of funding that goes to LMI communities by the percentage of the population living in those areas. A value above 1 means funding is overrepresented relative to the LMI population, while a value below 1 signifies funding is underrepresented.
Loan Numbers, Trends and Concentration
While consumer lending accounts for a substantial portion of CDFIs’ overall funding nationally, especially for CDFI credit unions, trends diverged between the Eighth District and the U.S. from 2018 to 2022. The Eighth District saw an increase in the number of consumer loans, compared with a decline nationally, despite both geographies experiencing similar growth in the total dollar amount of loans.
Additionally, the Eighth District’s average consumer loan size was more than double that of the national average. Finally, lending in the Eighth District was more evenly distributed across metropolitan, micropolitan and rural areas, as well as across communities by income level, in contrast to the national trend of greater concentration in urban areas and in middle- and upper-income communities.
Notes
- These reports represent a sample of all CDFI lending and investing activity, as only CDFIs that receive a grant from the CDFI Fund are required to report their loans and investments. As such, the composition of the sample can change over time, which may affect funding trends observed.
- According to the CDFI Fund’s definition (PDF), a consumer loan made by a CDFI is one in which a personal, secured or unsecured loan is extended to one or more individuals for specific purposes such as health, education, emergencies, credit repair, debt consolidation or other consumer-related needs. Notably, this definition excludes personal loans made for business purposes, as well as loans intended for home improvement or home repair.
- CDFI Consumer Loan Reports and Transaction Level Reports, 2018-22.
- Author’s calculation based on 2018-22 CDFI Fund Consumer Loan Reports obtained via a nondisclosure agreement.
- Author’s calculations of data from the Federal Reserve 2023 CDFI Survey.
- Median amounts cannot be calculated because the source data only provides total amount and total number of loans.
- The funding-to-population ratio for metro areas of the U.S. and the Eighth District, for example, is calculated by dividing the percentage of funding that goes to a geography’s metropolitan areas by the percentage of the population living in those areas. This accounts not only for differences in funding amounts, but also for differences in the demographic composition of metro areas. A value of 1 indicates the share of funding is representative of the population. The same methodology is applied to micropolitan areas, rural areas, and low- and moderate-income areas.
- According to Office of Management and Budget definitions, metropolitan statistical areas include at least one urbanized area of 50,000 or more inhabitants and micropolitan statistical areas include at least one urban cluster of at least 10,000 but fewer than 50,000 people.

Citation
Michael Eggleston, ldquoExploring Trends in Community Development Consumer Lending,rdquo St. Louis Fed On the Economy, June 17, 2025.
This blog offers commentary, analysis and data from our economists and experts. Views expressed are not necessarily those of the St. Louis Fed or Federal Reserve System.
Email Us
All other blog-related questions