


The Use of AI in the Health Care Workplace: The Experience in Eighth District States
In the first blog post of this two-part series, I described AI use in hospitals nationally and then compared AI adoption by metro, metro-adjacent and not-metro-adjacent hospitals. This second post will dive deeper into state-specific data for states that form part of the Eighth Federal Reserve District: Arkansas, Illinois, Indiana, Kentucky, Mississippi, Missouri and Tennessee.The Eighth District covers all of Arkansas, most of Missouri, and parts of Illinois, Indiana, Kentucky, Mississippi and Tennessee. This analysis used state-level data. While the data come from only one point in time (2023), breaking down the data by individual states is important because it can show how AI adoption is dispersed, highlights where there is opportunity for adoption, and may inspire research on the ramifications of adoption on economic development in the communities that integrate this technology.
How Could Hospitals Be Impacted by AI in the Eighth District?
AI has the potential to transform the workforce, create new jobs, and possibly displace existing workers. With 984 hospitals spread out across Eighth District communities, the health care and employment prospects of thousands of residents may be impacted.
AI presents a double-edged sword, especially in rural communities. The technology could fill a skill shortage (e.g., through remote monitoring of wearable sensors that can reduce the need for in-person visits) or displace existing workers (e.g., administrative staff who schedule appointments, register patients and process billing). For smaller rural communities that can access AI, the technology has the potential to make them more productive by automating tasks, scheduling staff, and optimizing administrative and clinical work to make the existing workforce more efficient. However, more productivity does not necessarily ensure prosperity.
AI Use in Health Care in the Eighth District
The following table displays the trends in AI adoption for Eighth District states in comparison to national numbers featured in last week’s blog post. Within Eighth District states, higher proportions of overall AI use were reported by hospitals, in each geographical category, compared with hospitals nationally: hospitals in metro areas (46.7% versus 43.9%, respectively); hospitals in nonmetro areas that are adjacent to a metro area (38.1% versus 28.1%); and hospitals in nonmetro areas that are not adjacent to a metro area (27.1% versus 17.7%).
Within individual District states, Missouri, Illinois and Tennessee had the highest proportions of AI use, Indiana had moderate AI use, and Arkansas, Kentucky and Mississippi reported the lowest use. However, data from Mississippi should be interpreted with caution because of the state’s low response rate.Mississippi’s response rate was only 18.6%, significantly lower than the rate for other Eighth District states: Arkansas, 76.6%; Illinois, 56.5%; Indiana, 46.1%; Kentucky, 27.3%; Missouri, 26.6%; and Tennessee, 35.0% based on those who responded to the optimizing administrative and clinical work item. There was slight variation for other AI uses, depending on task. Nationally, the response rate was 45.1%.
| U.S. | Eighth District | Ark. | Ill. | Ind. | Ky. | Miss. | Mo. | Tenn. | |
|---|---|---|---|---|---|---|---|---|---|
| Any AI Use | |||||||||
| Metro | 43.9% | 46.7% | 20.0% | 56.4% | 29.4% | 14.3% | 0% | 100% | 50.0% |
| Metro-Adjacent | 28.1% | 38.1% | 8.3% | 42.1% | 40.0% | 20.0% | 0% | 100% | 44.4% |
| Not-Metro-Adjacent | 17.7% | 27.1% | 5.6% | 42.9% | 33.3% | 33.3% | 0% | 100% | 0% |
| Automating Tasks | |||||||||
| Metro | 30.4% | 36.1% | 5.0% | 51.3% | 23.5% | 9.5% | 0% | 71.4% | 38.5% |
| Metro-Adjacent | 18.6% | 27.8% | 4.2% | 36.8% | 30.0% | 20.0% | 0% | 70.0% | 27.8% |
| Not-Metro-Adjacent | 11.6% | 12.5% | 0% | 14.3% | 33.3% | 0% | 0% | 75.0% | 0% |
| Optimizing Administrative and Clinical Work | |||||||||
| Metro | 33.6% | 37.4% | 7.5% | 51.3% | 29.4% | 14.3% | 0% | 64.3% | 42.3% |
| Metro-Adjacent | 21.3% | 32.0% | 4.2% | 36.8% | 40.0% | 20.0% | 0% | 70.0% | 38.9% |
| Not-Metro-Adjacent | 13.2% | 22.9% | 5.6% | 35.7% | 33.3% | 0% | 0% | 100% | 0% |
| Predicting Patient Demand | |||||||||
| Metro | 25.5% | 21.6% | 12.5% | 17.9% | 17.6% | 9.5% | 0% | 71.4% | 15.4% |
| Metro-Adjacent | 15.8% | 18.6% | 8.3% | 31.6% | 10.0% | 20.0% | 0% | 60.0% | 16.7% |
| Not-Metro-Adjacent | 7.4% | 6.3% | 0% | 7.1% | 0% | 0% | 0% | 50.0% | 0% |
| Predicting Staffing Needs | |||||||||
| Metro | 25.1% | 21.1% | 5.0% | 20.5% | 14.7% | 0% | 0% | 75.0% | 15.4% |
| Metro-Adjacent | 13.6% | 18.6% | 8.3% | 36.8% | 0% | 0% | 0% | 60.0% | 16.7% |
| Not-Metro-Adjacent | 7.4% | 6.3% | 0% | 7.1% | 0% | 0% | 0% | 50.0% | 0% |
| Scheduling Staff | |||||||||
| Metro | 20.4% | 18.9% | 2.5% | 16.7% | 14.7% | 0% | 0% | 67.9% | 19.2% |
| Metro-Adjacent | 13.9% | 21.6% | 8.3% | 36.8% | 10.0% | 20.0% | 0% | 70.0% | 11.1% |
| Not-Metro-Adjacent | 8.7% | 12.5% | 0% | 7.1% | 0% | 33.3% | 0% | 100% | 0% |
| SOURCES: American Hospital Association and author’s calculations. | |||||||||
| NOTES: Geography was determined by the USDAs Rural-Urban Continuum Codes, which divide counties in nine different levels based on their proximity to a metro area and population size. Codes were aggregated into three larger categories: Codes 1 through 3 constituted metro areas with a population of 250,000 or more; codes 4, 6 and 8 are nonmetro areas adjacent to a metro area; and codes 5, 7 and 9 are nonmetro areas not adjacent to a metro area. Statistical tests for significance were not performed for individual states and metro proximity due to low sample sizes. | |||||||||
Generally, a greater proportion of metro hospitals integrated AI in their operations than metro-adjacent and not-metro-adjacent hospitals. It is notable that Missouri indicated high adoption of AI, with 100% of responding hospitals reportedly utilizing some form of AI regardless of geographical location. Differences among Missouri’s metro, metro-adjacent and not-metro-adjacent hospitals were more apparent regarding specific types of AI use; however, adoption rates still ranged between 50% and 75% of hospitals. In contrast, Arkansas had a relatively low adoption rate for all types of AI among all geographies. Given that Arkansas also had the best response rate among District states, this suggests that AI has not been integrated well into Arkansas health care workplaces.
Once again, it is important to note that the data are from one point in time, so it is unclear why AI adoption is higher in some states than others. Some states could have adopted it earlier, or it could have caught on quicker once introduced in some states rather than others. The big question involves what this may mean for the Eighth District if growth in Missouri’s adoption rate continues to outpace those of other District states, or if growth in metro areas’ adoption rates exceeds growth of those in metro-adjacent and not-metro-adjacent areas.
Likelihood of AI Use by Geographical Area
As in the first blog post, the same series of three-step hierarchical logistic regressions were used to test whether the likelihood of AI use was significantly less likely in metro-adjacent or not-metro-adjacent hospitals compared with metro hospitals (step 3) beyond hospital ownership type (step 1) and workforce size (step 2). Significant odds ratios, or how probable AI use was, are indicated with an asterisk in the second figure; there were no statistically significant odds ratios in the first figure. To understand the likelihood of odds ratios less than 1, subtract the odds ratio from 1 to get the likelihood score.
When considering whether geographical location in District states decreased the probability of types of AI use beyond ownership type and workforce size, we begin to see patterns different from the national data. Namely, the statistical analysis (or results) suggests that unlike the national data shown in the first post in this two-part series, metro-adjacent hospitals did not implement AI significantly less than metro hospitals and, in most cases, actually were more likely to implement it but not at a statistically significant level. Not detecting any statistically significant odds ratios may suggest that metro-adjacent hospitals have adoption rates not significantly different from metro hospitals because they are able to access metro resources easier or learn from metro hospitals. However, causality cannot be determined, and without more data, there is only speculation around why no significant results were detected. (See the first figure.)
Odds Ratios of AI Use in 2023: Metro-Adjacent vs. Metro Hospitals in Eighth District States
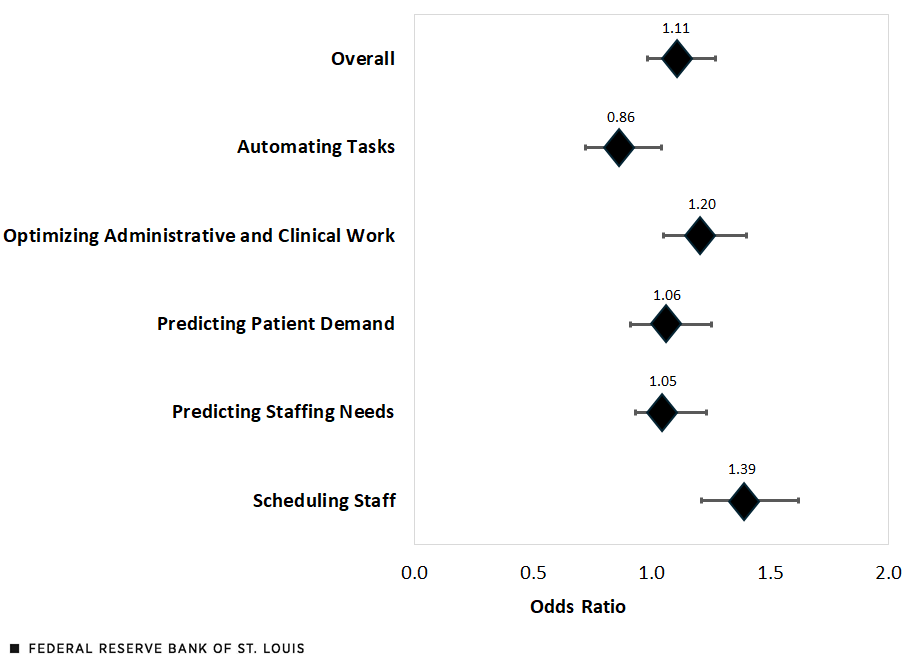
SOURCES: American Hospital Association and author’s calculations.
NOTES: The odds ratios were not statistically significant. The horizontal lines represent the lower and upper limits of a 95% confidence interval. By subtracting the odds ratio from 1 and multiplying by 100, the result indicates how less likely or more likely a metro-adjacent hospital would use AI compared with a metro hospital.
However, not-metro-adjacent hospitals as of 2023 adopted three types of AI significantly less than metro hospitals: automating tasks, predicting patient demand and predicting staff needs. To elaborate, as of 2023, not-metro-adjacent hospitals were 73% less likely to adopt AI for automating tasks, 73% less likely for predicting patient demand, and 72% less likely for predicting staffing needs. Further analyses by individual District states could not be performed due to low sample size. (See the second figure.)
Odds Ratios of AI Use in 2023: Not-Metro-Adjacent vs. Metro Hospitals in Eighth District States
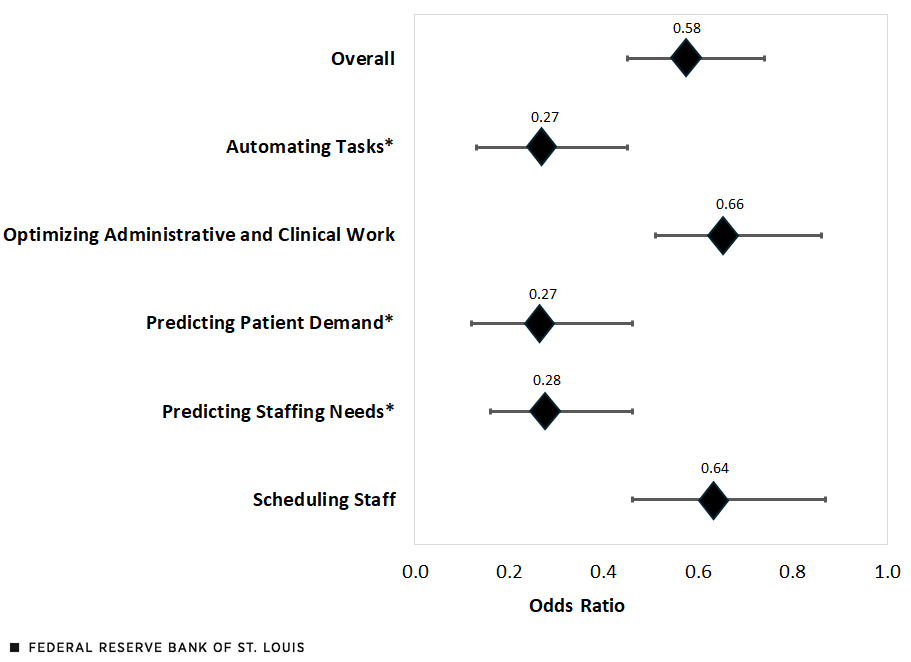
SOURCES: American Hospital Association and author’s calculations.
NOTES: Asterisks denote AI functions with results that were statistically significant. The horizontal lines represent the lower and upper limits of a 95% confidence interval. By subtracting the odds ratio from 1 and multiplying by 100, the result indicates how less likely a not-metro-adjacent hospital would use AI compared with a metro hospital.
Considerations in AI with Rural Communities Moving Forward
Looking toward the future, as hospitals, especially those in rural communities, consider the integration of AI into their systems, there may be important considerations for the organization and the communities they serve to ensure rural prosperity.
- Data Bias. Getting broad datasets to train AI is challenging. The type of data used to train the AI model is crucial, and data that are not representative of the population have led to AI being biased in hiring practices and resource allocation. Therefore, if the training model does not contain enough information about rural patients and rural communities, there may not be sufficient data to optimize the needs of smaller communities.
- Partnership and Investment. As hospitals consider integrating AI to optimize health care operations, mentoring by or partnering with other local hospitals that already adopted AI technologies (e.g., rural Missouri hospitals, as shown in the table) may reduce the rollout time and sustainability.
- Economic Impact. To implement such systems, there may be increases (e.g., tech support) and reductions (e.g., administrative staff) in various health care jobs. It is unclear how great the economic impact of AI on the health care workforce will be in small communities where it can be challenging to obtain high-paying local jobs.
In conclusion, as of 2023, more-rural not-metro-adjacent hospitals adopted AI less than hospitals in larger communities, both nationally and within the District states. Looking toward the future, this brings up the question of how communities may differ economically and whether AI adoption can be sustained in smaller communities in a way that benefits both the employer and employees.
Notes
- The Eighth District covers all of Arkansas, most of Missouri, and parts of Illinois, Indiana, Kentucky, Mississippi and Tennessee. This analysis used state-level data.
- Mississippi’s response rate was only 18.6%, significantly lower than the rate for other Eighth District states: Arkansas, 76.6%; Illinois, 56.5%; Indiana, 46.1%; Kentucky, 27.3%; Missouri, 26.6%; and Tennessee, 35.0% based on those who responded to the optimizing administrative and clinical work item. There was slight variation for other AI uses, depending on task. Nationally, the response rate was 45.1%.

Citation
Nicole Summers-Gabr, ldquoThe Use of AI in the Health Care Workplace: The Experience in Eighth District States,rdquo St. Louis Fed On the Economy, July 24, 2025.
This blog offers commentary, analysis and data from our economists and experts. Views expressed are not necessarily those of the St. Louis Fed or Federal Reserve System.
Email Us
All other blog-related questions