


The Use of AI in the Health Care Workplace: The U.S. Experience
Spending on the research and application of artificial intelligence (AI) in health care was estimated to be $6.1 billion in 2023 ($19.3 billion globally) and by 2034 is projected to be $195 billion ($613.8 billion globally). While AI can be incorporated into many health care establishments, one establishment that can be found in many places—from large cities to small rural communities—is the hospital. There are over 6,000 hospitals in the U.S., of which a little over 80% are community hospitals. Community hospitals alone provide over 6.4 million jobs directly and 17.9 million indirectly, which means that when the health care workforce is impacted, a cascade of other jobs could be as well.
AI has the potential to impact the health care workforce by optimizing operations and potentially addressing worker shortages and gaps in access to care. It is already being used in a wide range of functions, such as assisting in robotic surgeries and improving care coordination. It can also discover and develop drugs (PDF), personalize medicine, automate administrative tasks and monitor patients remotely. However, not all hospitals may have the infrastructure in staffing and technology to implement these systems; this may especially be the case for hospitals in more rural communities.
Why Analyze Data by Metro Proximity?
This blog post, the first in a two-part series, aims to understand the adoption of AI implemented in health care workplaces by analyzing geographical differences: hospitals in metropolitan counties (metro), hospitals in nonmetro counties that are adjacent to metro areas (metro-adjacent), and hospitals in nonmetro counties that are not adjacent to metro areas (not-metro-adjacent).
Nonmetro hospitals will serve as a proxy for those in rural areas, with not-metro-adjacent hospitals capturing the adoption of AI in rural communities that are more isolated. The value in parsing out metro-adjacent versus not-metro-adjacent data is that it will generate a better understanding of AI resources communities can access. The theory of agglomeration suggests that there are economic advantages for businesses and people based on proximity to other industries. One way this occurs is through “knowledge spillover” (PDF), which leads to innovation and sharing information. If hospitals are closer to metro areas, it means that residents may be able to take advantage of the AI resources nearby and hospitals may have an easier time learning how other hospitals adopted AI technologies. Finally, this type of analysis will help reveal AI use by hospitals in more isolated rural communities.
New AI Data Available for Hospitals
It is now possible to glimpse a snapshot of AI adoption in health care workplaces because the American Hospital Association (AHA) recently started collecting data on this topic. Every year, thousands of hospitals participate in the AHA’s annual survey to describe hospital demographics and services. In 2023, the latest survey data publicly available, out of 6,390 hospitals across the nation, 2,881 (45.1%) responded to the AI items. Unlike other items in the survey, AI items do not have estimates to address response gaps, which means the data provided on these are lower than other variables in the survey. At the same time, response rates were better for some states than others.
AI Use in Hospitals Nationally
On a national level, 43.9% of responding hospitals in metro counties reported using some type of AI in their operations, with a lower proportion of hospitals indicating use in metro-adjacent counties (28.1%) and an even smaller proportion in not-metro-adjacent counties (17.7%). (See the table below.) When considering the individual types of AI (automating tasks, optimizing administrative and clinical work,* predicting patient demand, predicting staffing needs and scheduling staff), the patterns are consistent, with the greatest use by metro hospitals and the lowest adoption in not-metro-adjacent hospitals.
| Any AI Use | Automating Tasks | Optimizing Administrative and Clinical Work* | Predicting Patient Demand | Predicting Staffing Needs | Scheduling Staff | |
|---|---|---|---|---|---|---|
| Metro | 43.9% | 30.4% | 33.6% | 25.5% | 25.1% | 20.4% |
| Metro-Adjacent | 28.1% | 18.6% | 21.3% | 15.8% | 13.6% | 13.9% |
| Not-Metro-Adjacent | 17.7% | 11.6% | 13.3% | 7.4% | 7.4% | 8.7% |
| SOURCES: American Hospital Association and author’s calculations. | ||||||
| NOTES: Geography was determined by the USDA’s Rural-Urban Continuum Codes, which divide counties into nine different levels based on their proximity to a metro area and population size. Codes were aggregated into three larger categories: Codes 1 through 3 constituted metro areas with a population of 250,000 or more; codes 4, 6 and 8 are nonmetro areas adjacent to a metro area; and codes 5, 7 and 9 are nonmetro areas not adjacent to a metro area. | ||||||
Likelihood of AI Use by Geographical Area
To understand whether these geographical differences between hospitals are statistically significant, it is important to consider other hospital characteristics that may be correlated with AI use, such as type of hospital ownership (i.e., private, nonprofit, government) and workforce size. Certain types of hospitals may have more autonomy or funding to adopt such systems. It is also possible that larger hospitals had a greater capacity to implement and maintain these systems.
Therefore, a series of three-step hierarchical logistic regressions were run to test each type of AI use. Specifically, whether the probability of AI use was significantly less likely in metro-adjacent or not-metro-adjacent hospitals compared with metro hospitals (step 3) beyond hospital ownership type (step 1) and workforce size (step 2). The next two figures show the odds ratio, which was significant in all the categories. To understand the meaning of odds ratios that are less than 1, subtract the score from 1 to understand the decrease in the odds.
Results in the first figure revealed that metro-adjacent hospitals were significantly less likely to use all types of AI than metro hospitals. For instance, metro-adjacent hospitals were 42% less likely to utilize AI for task automation and 32% less likely to adopt it for scheduling staff than metro hospitals.
Odds Ratios of AI Use in 2023: Metro-Adjacent vs. Metro Hospitals*
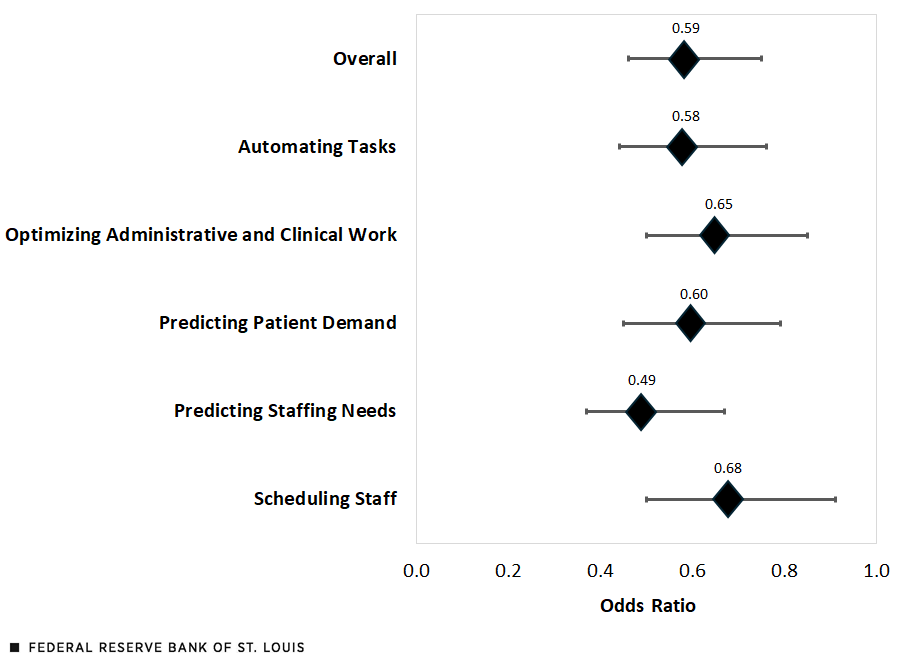
SOURCES: American Hospital Association and author’s calculations.
NOTES: The horizontal lines represent the lower and upper limits of a 95% confidence interval. By subtracting the odds ratio from 1 and multiplying by 100, the result indicates how less likely a metro-adjacent hospital would be to use AI compared with a metro hospital.
The second figure shows that for not-metro-adjacent hospitals the contrast is even greater; these hospitals were 64% less likely to adopt AI use for task automation and 57% less likely to adopt it for scheduling staff.
Odds Ratios of AI Use in 2023: Not-Metro-Adjacent vs. Metro Hospitals*
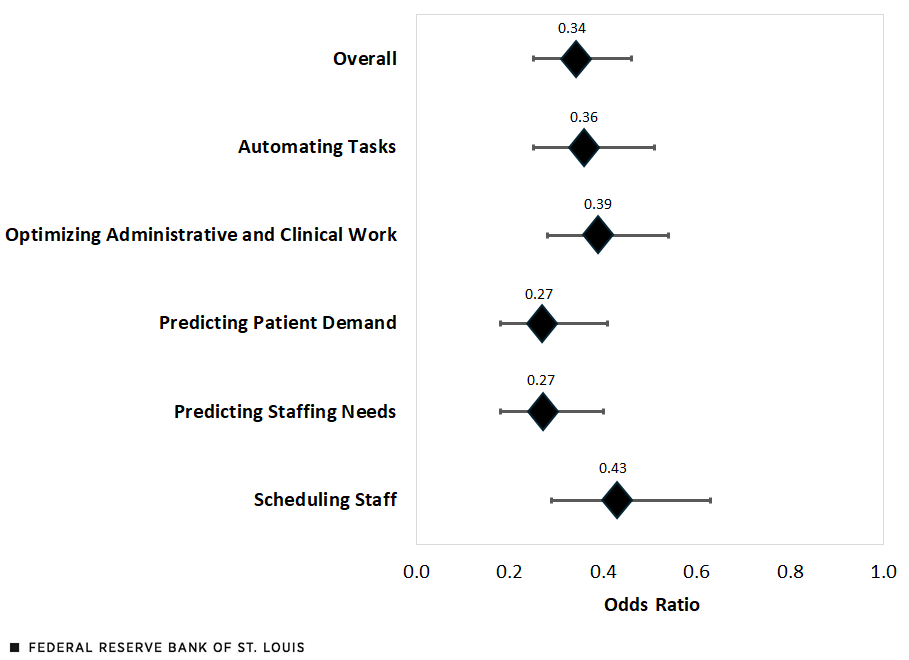
SOURCES: American Hospital Association and author’s calculations.
NOTES: The horizontal lines represent the lower and upper limits of a 95% confidence interval. By subtracting the odds ratio from 1 and multiplying by 100, the result indicates how less likely a not-metro-adjacent hospital would be to use AI compared with a metro hospital.
Upcoming Look at Regional Differences
It is important to reiterate that these data were cross sectional, i.e., they look at a particular point in time (in this case, 2023). As such, they cannot illustrate whether there has been more growth in AI use in urban over rural hospitals. However, these data do paint a picture of the current state of adoption at a national level. In part two of this series, I will dive deeper into the data by disaggregating AI use by states that are part of the Eighth Federal Reserve District (Arkansas, Illinois, Indiana, Kentucky, Mississippi, Missouri and Tennessee) and metro proximity. Finally, we will explore considerations for AI use in rural communities in the future.
*This post was updated July 18, 2025, to correct the name of an AI use category to include administrative work.

Citation
Nicole Summers-Gabr, ldquoThe Use of AI in the Health Care Workplace: The U.S. Experience,rdquo St. Louis Fed On the Economy, July 15, 2025.
This blog offers commentary, analysis and data from our economists and experts. Views expressed are not necessarily those of the St. Louis Fed or Federal Reserve System.
Email Us
All other blog-related questions