


Where Might Inflation Head?
In my previous post, I outlined why the current episode of high inflation has been persistent and widespread. In this post, I examine the impact of fiscal and monetary policies during this episode and provide a plausible outlook for the near future.
Monetary Policy
At the onset of the pandemic, the Federal Reserve adopted an accommodative policy stance to support the economy. Notably, the Federal Reserve dropped the target for the federal funds rate to near zero, opened a series of temporary liquidity facilities and resumed its program of large-asset purchases. As high inflation proved persistent over 2021, the Federal Reserve switched to a contractionary monetary policy designed to bring inflation down to its target. The process of tapering asset purchases started in September 2021, and the federal funds rate was raised off zero in March 2022.
The first figure shows inflation (excluding energy prices), the federal funds rate and the yield of a 10-year Treasury note, up to March 2023.Inflation is measured as the 12-month change in the personal consumption expenditures (excluding energy) price index. The federal funds rate and the yield on Treasuries correspond to their monthly averages. The federal funds rate, which is the rate at which banks trade reserves with each other overnight, has increased very rapidly since the Federal Reserve began its rate hike cycle in March 2022.
The evolution of the 10-year Treasury yield reflects the combined effects of balance sheet policy and expectations about future policy rates. Balance sheet policy refers to the policy of buying and selling of Treasuries and agency mortgage-backed securities by the Federal Reserve, which is designed, in part, to affect long-term rates directly. Expectations about future policy rates are affected by the Federal Reserve’s guidance on future monetary policy and market participants’ own views on future inflation.
Viewed through this longer-term lens, as reflected by the 10-year Treasury yield, contractionary monetary policy started significantly earlier than March 2022. Of note, in recent months, short-term rates (e.g., the federal funds rate) are above long-term rates (e.g., 10-year Treasury yield). In other words, the nominal yield curve is inverted, which is likely the product of markets expecting a decline in inflation and a slowdown in economic activity.
Inflation and Interest Rates
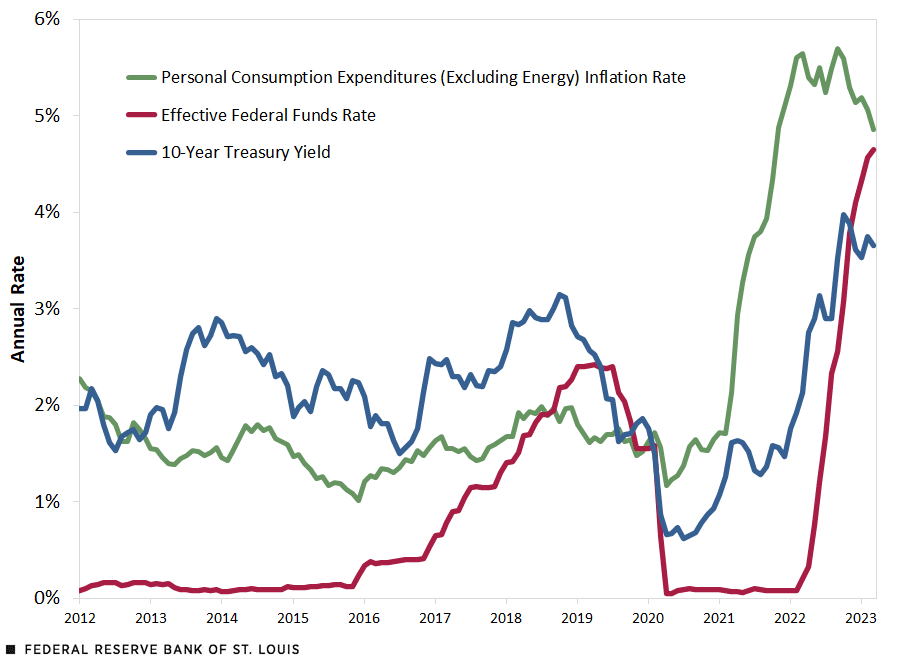
SOURCES: Bureau of Economic Analysis, Haver Analytics and Federal Reserve Economic Data (FRED).
NOTES: Inflation is measured as the 12-month change in the personal consumption expenditures (excluding energy) price index. The federal funds rate and the yield on Treasuries correspond to their monthly averages.
Consumption
One of the key mechanisms through which higher interest rates lower inflation is through their effect on consumption. As interest rates rise, the demand for consumption is pressured downward, because higher interest rates make consumer financing more costly and increase the incentives to save. Lower demand then leads to lower inflationary pressures as producers and sellers find it more difficult to hike their prices.
The second figure shows monthly personal consumption expenditures in 2012 dollars. (Looking at constant prices removes the direct effect of inflation on expenditures and lets us focus on quantities consumed.) The figure also includes the 2016-19 trend, to better understand the behavior of consumption during the pandemic.
Monthly Real Consumption
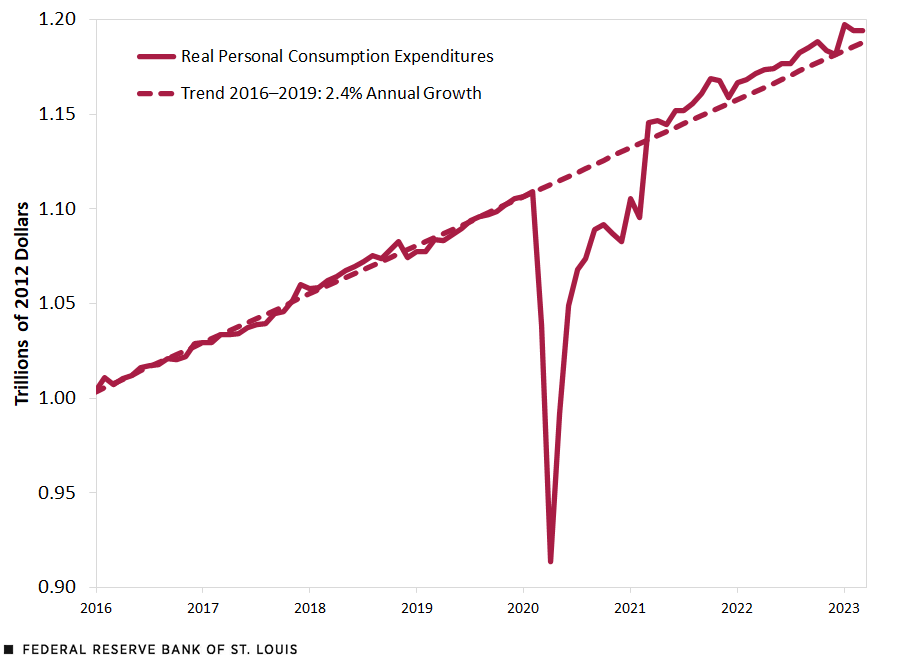
SOURCES: Bureau of Economic Analysis and author’s calculations.
Real consumption dropped sharply during the early months of the pandemic. The initial decline was across the board. Starting in mid-2020, consumption of goods boomed while consumption of services remained depressed—a result of households’ response to the lockdown measures implemented at the time.
Real consumption returned to trend in March 2021, the same month that inflation crossed 2%, and it has remained above trend ever since. So, though interest rates have been high, real consumption has remained persistently elevated. However, if we take the difference between actual consumption and its pre-pandemic trend, we get an accumulated deficit of $571 billion (in 2012 prices) since the start of the pandemic. That is, real consumption expenditures would have been higher overall, had they remained on trend during the pandemic. This deficit translates into $721 billion in March 2023 prices, or about half of monthly consumption.
Although expenditures in goods boomed during the pandemic (especially durables), the significant drop in services expenditures has not yet been made up and suggests that further elevated demand for services may persist for some time as consumers make up for past privations (e.g., leisurely activities such as vacations).
The Impact of Higher Interest Rates on Consumption
Can consumers sustain elevated expenditures despite high interest rates? To answer this, we need to also look at income. Big deficits were a key component of the government’s response to the pandemic, significant parts of which consisted of direct transfers to individuals, as well as other forms of assistance that eventually made their way to consumers.A total of $814 billion in financial relief went directly to households impacted by the pandemic. According to the Congressional Budget Office, the combined deficit in fiscal years 2020 and 2021 was about $5.9 trillion, or 13.6% of gross domestic product (GDP) on average. The deficit in fiscal year 2022 was a further $1.4 trillion, or 5.5% of GDP. See the CBO’s data.
The third figure shows monthly disposable income and personal consumption, both in current prices, and their respective 2016-19 trends. We can see how the three rounds of direct federal assistance in 2020 and 2021 significantly increased households’ disposable income. Relative to the pre-pandemic trend, accumulated excess income totals $1.42 trillion, while accumulated excess consumption amounts to $1.04 trillion. Thus, households still have about $372 billion of excess savings at their disposal—roughly half of the missing consumption I calculated above. That is, consumers on aggregate could still finance half of their lost consumption with excess savings resulting from fiscal assistance.
Monthly Income and Consumption

SOURCES: Bureau of Economic Analysis and author’s calculations.
Conclusion
Despite higher interest rates and inflation, consumption demand has remained strong. Households have been making up for pandemic-related privations, largely financed by excess savings that resulted from the fiscal assistance provided during the pandemic. Even higher interest rates may put further downward pressure on consumption demand (by penalizing credit and incentivizing savings). However, there is a strong possibility that consumption will remain high while excess savings persist, resulting in high inflation for longer despite a contractionary monetary policy.
Inflation for 2023 may end up being well above the 2% target, though perhaps not as elevated as in 2021 and 2022. The moderation in the inflation rates for food and core goods, should it persist, would contribute to the moderation in overall inflation. Housing may eventually contribute as well. In contrast, core services excluding housing may continue to keep inflation elevated, sustained by pent-up demand and the ability to self-finance excess expenditures. It remains an open question as to how much of this excess inflationary pressure will be arrested by contractionary monetary policy, and hence, how long it will take for inflation to return to the Federal Reserve’s 2% target.
Notes
- Inflation is measured as the 12-month change in the personal consumption expenditures (excluding energy) price index. The federal funds rate and the yield on Treasuries correspond to their monthly averages.
- A total of $814 billion in financial relief went directly to households impacted by the pandemic. According to the Congressional Budget Office, the combined deficit in fiscal years 2020 and 2021 was about $5.9 trillion, or 13.6% of gross domestic product (GDP) on average. The deficit in fiscal year 2022 was a further $1.4 trillion, or 5.5% of GDP. See the CBO’s data.

Citation
Fernando M. Martin, ldquoWhere Might Inflation Head?,rdquo St. Louis Fed On the Economy, May 9, 2023.
This blog offers commentary, analysis and data from our economists and experts. Views expressed are not necessarily those of the St. Louis Fed or Federal Reserve System.
Email Us
All other blog-related questions