


Is Inflation Making a Comeback?

The average price level dropped sharply during the early stages of the COVID-19 pandemic and has gradually recovered since then. As a result, annual inflation has remained low:
- The 12-month change in the personal consumption expenditure (PCE) price index reached 0.5% in April 2020, its smallest increase that year.
- Core PCE inflation (which excludes food and energy) registered 0.9% in the same month.
Since then, both measures have remained well below the Federal Reserve’s 2% annual inflation target.
Recent Trends in Inflation
By January, both PCE and core PCE price indexes were back to their pre-COVID-19 trends. This suggests an interesting exercise: Assuming prices remain on trend, what will inflation be in 2021? We can think of this exercise as informing us of the “mechanical” inflation resulting from things returning to normal.
The figure below shows actual PCE inflation and projected inflation for the remainder of the year.If we conducted the exercise excluding food and energy, the results would be very similar. I projected inflation by taking the PCE price index from 2015 to 2019 and projecting it onward, and then calculated future inflation as the growth rate between the projected index and the actual price index from 12 months prior.
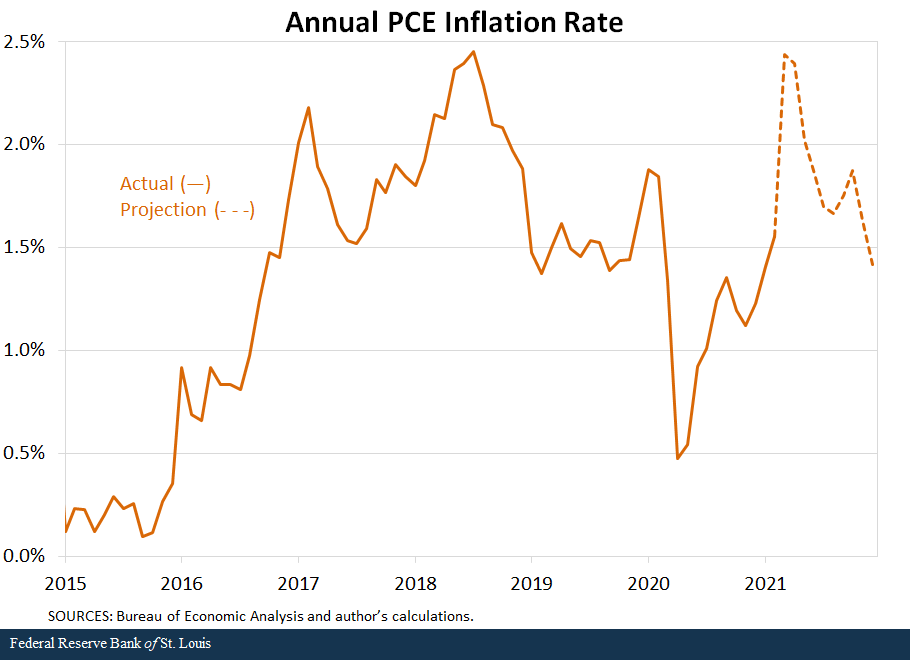
As we can see, these estimates project annual inflation above 2% for three months (March, April and May) and converging back to the pre-pandemic average towards the end of the year.
Given the new framework for monetary policy adopted last August, this temporary and mild rise of inflation would be consistent with the Fed’s objective, stated as “following periods when inflation has been running persistently below 2 percent, appropriate monetary policy will likely aim to achieve inflation moderately above 2 percent for some time.”See the Federal Reserve Board of Governors’ statement on longer-run goals and monetary policy strategy. In other words, we should not expect the Fed to react to this temporary rise in inflation.
Inflation Hints from Other Macroeconomic Variables
The exercise I conducted assumes prices will follow their pre-pandemic trend. However, the pandemic and the policies implemented to combat it have significantly altered the economic landscape. Might these changes imply even higher inflation?
The following series of figures display several key macroeconomic variables, which articulate various views on inflation. All these variables suggest the presence of further inflationary pressures.
Inflation Expectations
We can think of inflation as a self-fulfilling prophecy where actual inflation depends on expected inflation. This view is shared by many central banks to explain long-run inflation. In this view, a successful central bank anchors inflation expectations around its target for inflation. The figure below shows one measure of expected inflation: the difference in the annual yields of five-year Treasury notes and five-year Treasury inflation-protected securities (TIPS).Note that TIPS are indexed to consumer price index (CPI) inflation, which is typically higher than PCE inflation. For example, average annual inflation from 2015 to 2019 was about 20 basis points higher when measured by CPI.
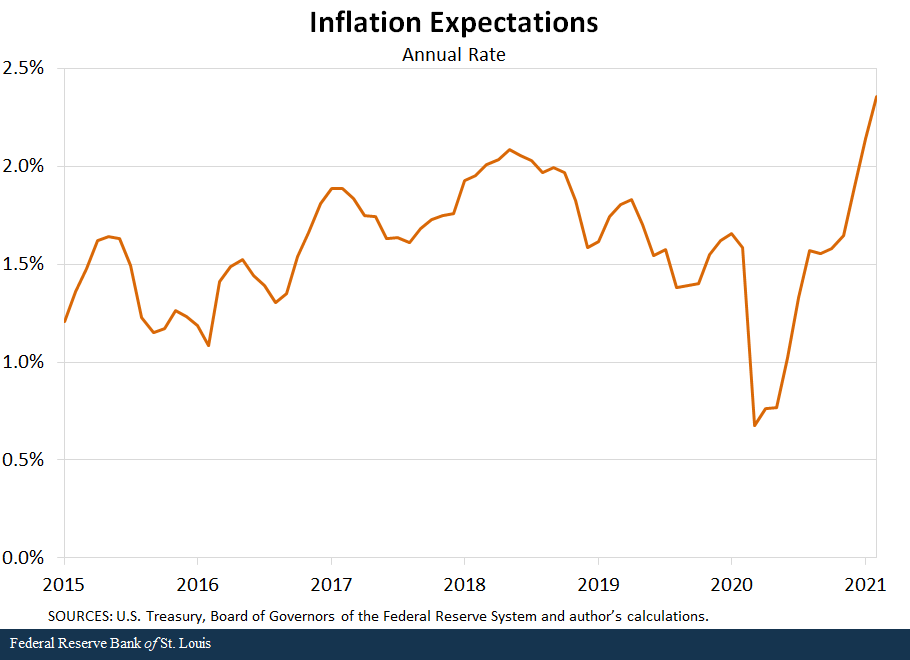
According to this measure, expectations about future inflation have been rapidly accelerating. This may be due in part to the adoption of the new monetary policy framework, as the market now understands that the Fed will let inflation temporarily rise above a 2% annual rate to make up for lost ground. However, it is a variable that deserves close monitoring, especially if it goes significantly above the Fed’s target.
Unemployment
The so-called Phillips curve states a negative relationship between inflation and unemployment. The theory—popular among central banks—leads one to expect higher (lower) inflation as the economy strengthens (weakens). As such, it is mostly used to explain cyclical variations in inflation around some long-run value.
The next figure shows two measures of unemployment:
- The official unemployment rate
- The U-6 rate, which includes those marginally attached to the labor force or employed part time for economic reasons
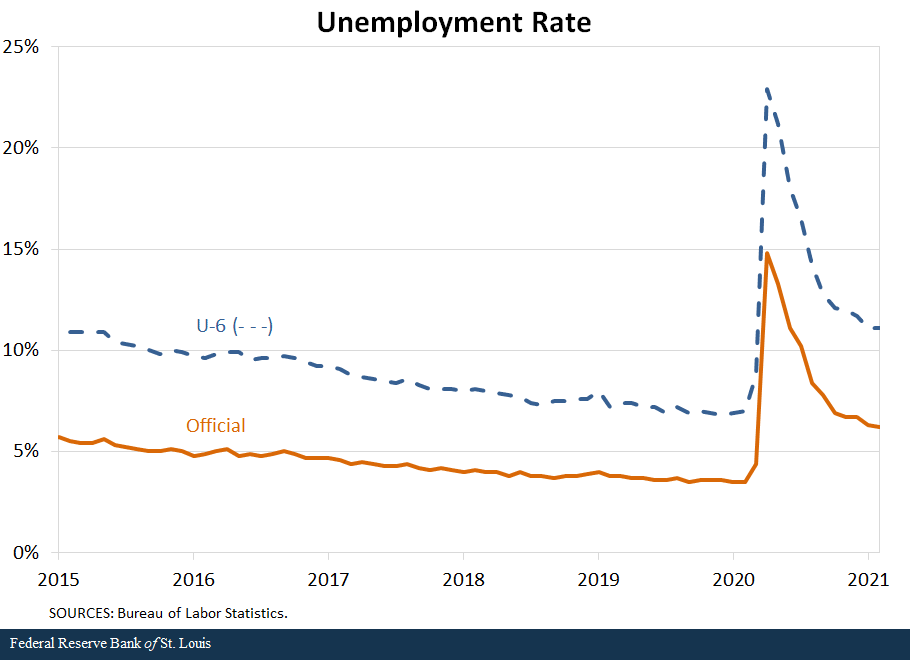
Both measures have recovered significantly but remain elevated relative to the pre-COVID-19 period. If the economy continues its strong recovery, unemployment is expected to fall even further, which would imply inflationary pressures.
Note, however, that the empirical relationship between inflation and unemployment has diminished significantly in recent years—if not altogether disappeared—and may not be relevant for the current episode, just as it was not during the previous recession.See Kristie Engemann’s 2020 Open Vault article “What Is the Phillips Curve (and Why Has It Flattened)?”
Monetary Aggregates
Monetarism is the theory that relates the price level to some monetary aggregate (e.g., currency) and inflation to the growth rate of monetary aggregates. In a modern economy, currency accounts for a small fraction of transactions, so economists look at “broader” monetary aggregates. The figure below shows two such aggregates (M2 and MZM), which both grew significantly between February and May 2020.Both aggregates include currency, checking and savings deposits. M2 adds small-denomination time-deposits and retail money market funds, while MZM adds institutional money market funds.
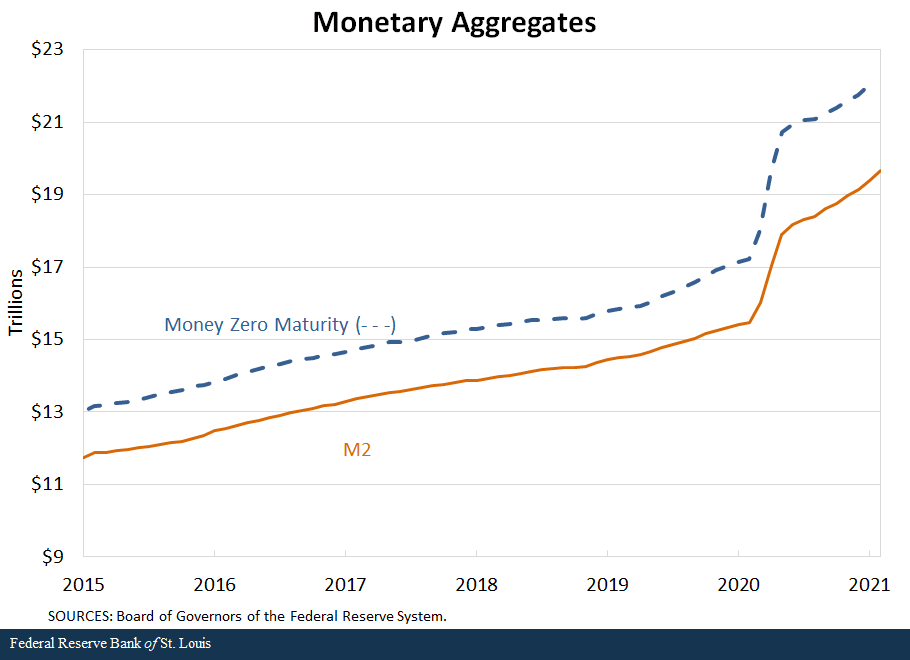
These increases coincided with the rise in personal savings during the same period, as households not only received substantial transfers from the federal government but also found it difficult to spend as they normally would.For more information, see Jim Bullard’s recent presentation “The Waning Pandemic and the U.S. Economy.” These additional savings likely imply a surge in the demand for goods and services as the economy returns back to normal, which would put upward pressure on prices.
How much prices increase due to this pent-up demand will also depend on how nimble supply is, and there are good reasons to believe that the recovery in supply may trail demand. Regardless, as evidenced in the chart, this channel would likely have a temporary (rather than permanent) effect on inflation.
Federal Debt
Various theories link prices or inflation to the level of debt and expected future fiscal surpluses. Though their mechanisms vary, they all predict higher prices or inflation as debt rises. The final figure shows the federal debt in the hands of the public (net of Fed holdings), which rose significantly between March and June 2020.
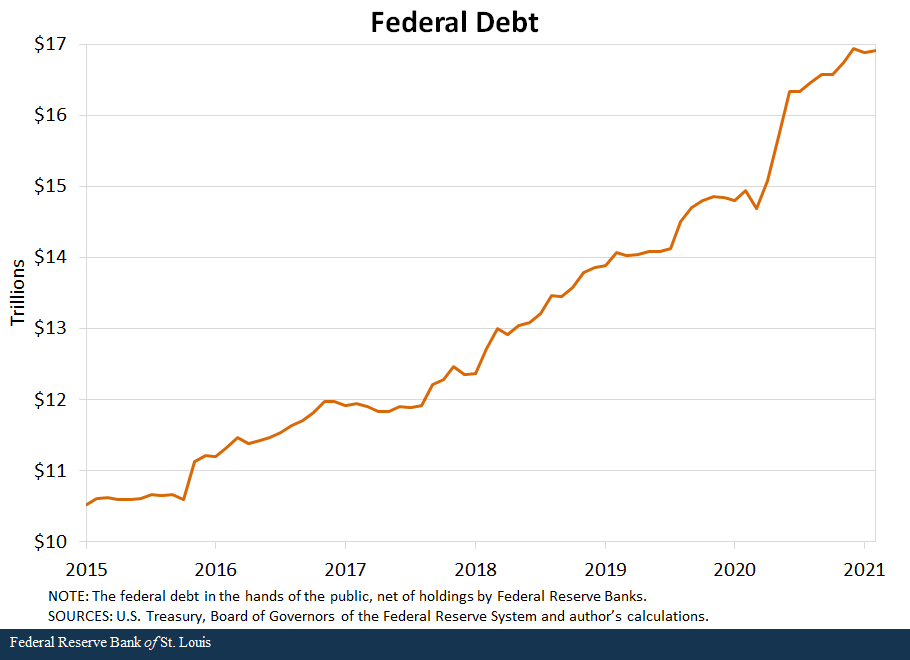
As with monetary aggregates, debt increased sharply in level, but its growth rate afterward remains roughly the same. As such, the effects, if any, will materialize as a temporary increase in inflation. However, note that current projections estimate deficits to remain large and growing as a fraction of the economy.See the Congressional Budget Office’s “2021 Long-Term Budget Outlook.” This trend may put additional pressures on future inflation.
Conclusion
In the coming months, it is likely that inflation will rise above 2% on an annual basis for a few months. We should neither be surprised nor expect the Fed to react.
However, several reasons point to further inflationary pressures. If these pressures materialize and prove persistent, the Fed will have to eventually step in to lower inflation and achieve its goal of 2% average inflation.
On the other hand, inflation may fail to materialize—as it has in the past—and instead return to its pre-pandemic average. In such a case, the Fed will face a choice: either continue to tolerate persistently undershooting its own target or adopt policies to deliberately raise inflation.
Notes and References
- If we conducted the exercise excluding food and energy, the results would be very similar.
- See the Federal Reserve Board of Governors’ statement on longer-run goals and monetary policy strategy.
- Note that TIPS are indexed to consumer price index (CPI) inflation, which is typically higher than PCE inflation. For example, average annual inflation from 2015 to 2019 was about 20 basis points higher when measured by CPI.
- See Kristie Engemann’s 2020 Open Vault article “What Is the Phillips Curve (and Why Has It Flattened)?”
- Both aggregates include currency, checking and savings deposits. M2 adds small-denomination time-deposits and retail money market funds, while MZM adds institutional money market funds.
- For more information, see Jim Bullard’s recent presentation “The Waning Pandemic and the U.S. Economy.”
- See the Congressional Budget Office’s “2021 Long-Term Budget Outlook.”
Additional Resources
- On the Economy: How Well Do Consumers Forecast Inflation?
- On the Economy: Does Rising National Debt Portend Rising Inflation?
- On the Economy: How COVID-19 May Be Affecting Inflation

Citation
Fernando M. Martin, ldquoIs Inflation Making a Comeback?,rdquo St. Louis Fed On the Economy, April 5, 2021.
This blog offers commentary, analysis and data from our economists and experts. Views expressed are not necessarily those of the St. Louis Fed or Federal Reserve System.
Email Us
All other blog-related questions