

Dating Economic Recessions in Real Time Is a Challenge
On July 28, 2022, the U.S. Bureau of Economic Analysis (BEA) reported that real gross domestic product (GDP) fell 0.9% at an annual rate during the second quarter of 2022. The decline in real GDP in the second quarter is significant because it follows a 1.6% rate of decline in the first quarter.
In the eyes of some economists and financial market participants, two consecutive quarters of negative real GDP growth is sufficient evidence to declare a recession. Indeed, in the 75-year history of quarterly estimates of real GDP growth, there has been only one episode when two consecutive quarters of negative real GDP growth was not associated with a recession episode; the nonrecessionary episode occurred in the second and third quarters of 1947. Thus, from a historical standpoint, two consecutive quarters of negative real GDP growth tends to be a reliable signal for dating recessions.
How the NBER Estimates Turning Points in the Business Cycle
The National Bureau of Economic Research (NBER) Business Cycle Dating Committee maintains a chronology of monthly and quarterly dates of peaks and troughs (i.e., turning points in the business cycle). Rather than the two-quarter definition, the NBER employs a more comprehensive approach to dating the beginning and end of recessions. Specifically, the NBER dates both the month and the quarter when economic activity peaked or troughed. Typically, the peak month occurs in the same quarter—but not always. For example, the NBER determined that the peak of the pandemic recession occurred in February 2020, but that the quarterly peak occurred in the fourth quarter of 2019.
For dating months of peaks and troughs, the NBER looks at several series, such as industrial production, nonfarm payroll employment, civilian employment, and real personal income less transfer payments. For dating quarters of peaks and troughs, the NBER examines estimates of the expenditure- and income-side measures of aggregate economic activity—otherwise known, respectively, as real GDP and real gross domestic income (GDI). The NBER also examines the average of GDP and GDI.
Challenges in Dating Peaks and Troughs
The NBER faces several challenges when determining peak and trough dates. First, the key monthly and quarterly economic data are backward-looking. For example, the June 2022 estimate of nonfarm payroll employment was not released until July 5, a lag of a little more than a month. Similarly, the July 28 advance estimate of second-quarter GDP was released with about a one-month lag. Although a one-month lag is not exceptionally long, the trade-off for quickness is incompleteness. That is, the BEA, the Bureau of Labor Statistics (BLS) and other government agencies must survey a subset of the total population of firms and households to infer a national estimate. For example, the BLS surveys 60,000 households and 131,000 businesses and government agencies. Moreover, the advance estimate for GDP is based on the BEA’s assumptions for some series that have no observation for the third month of the quarter, such as construction outlays.See the technical note for the advance release (PDF) of the second-quarter GDP report.
The second challenge facing the NBER is accounting for data revisions. Data revisions are the bane of policymakers and forecasters. Moreover, they can be substantial. For example, the BLS reported on Jan. 7, 2022, that nonfarm payrolls rose by 199,000 in December 2021, which was far short of the 400,000 that forecasters had expected. One month later (February 2022), the initial estimate was revised up to 510,000. A month after that (March 2022), the BLS reported that nonfarm payrolls were revised to show an increase of 588,000 in December.
To show how data revisions can complicate the NBER’s determination of dating recessions, the figures below plot the evolution of estimates for the change in nonfarm payrolls for December 2007 and the annualized growth of real GDP for the fourth quarter of 2007. The NBER determined these dates to be the peak of economic activity prior to the onset of the 2007‑09 recession. The data in the charts are available from the St. Louis Fed’s ALFRED website.
According to the BLS initial estimate in early 2008, nonfarm payrolls rose by 18,000 in December 2007. The following month, the December estimate was revised up to 82,000. In March 2008, the December estimate was cut in half to 41,000. Meanwhile, nonfarm payroll growth in subsequent months turned negative in February 2008 and fell continuously until November 2009.
The NBER announced on Dec. 1, 2008, that the recession began a year earlier in December 2007. Shortly thereafter, the BLS revised the December 2007 payroll estimate sharply higher to show a gain of 120,000. Today, the current vintage estimate shows that nonfarm payrolls rose 108,000 in December 2007—far above the initial estimate (18,000) and the estimate that prevailed at the time of the December 2008 recession announcement (41,000). (See the figure below.)
The Path of Revisions to the Monthly Change in Nonfarm Payrolls for December 2007
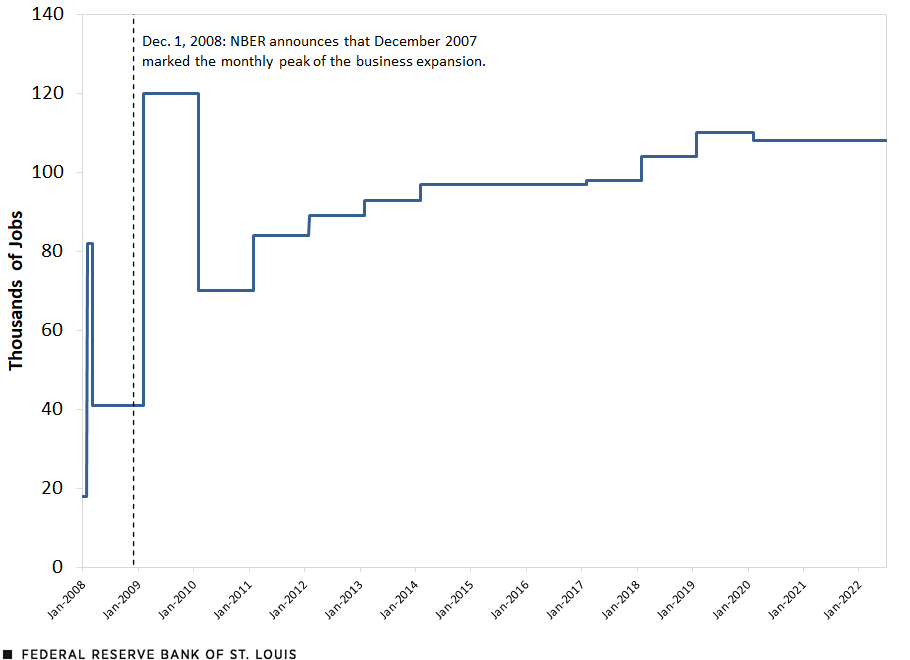
SOURCES: Bureau of Labor Statistics and ALFRED (Archival FRED).
The second figure plots the evolution of real GDP growth during the fourth quarter of 2007. In late January 2008, the BEA’s advance estimate showed that real GDP increased at a 0.6% annual rate in the fourth quarter of 2007. The advance estimate was little changed over the subsequent two revisions. Then, the BEA’s annual revision that was released in July 2008 showed that real GDP fell at a 0.2% annual rate. This estimate was unchanged when the NBER recession announcement occurred in December 2008. Over time, though, revisions have subsequently increased the initial estimate by a sizable amount. For a time, real GDP growth in the fourth quarter of 2007 was estimated to be as high as 2.9%. Today, the BEA’s current vintage estimate shows that real GDP increased at about a 2.5% annual rate in the fourth quarter of 2007—far above the initial estimate (0.6%) and the estimate that prevailed at the time of the December 2008 recession announcement (-0.2%).
The Path of Revisions to Real GDP Growth for the Fourth Quarter of 2007
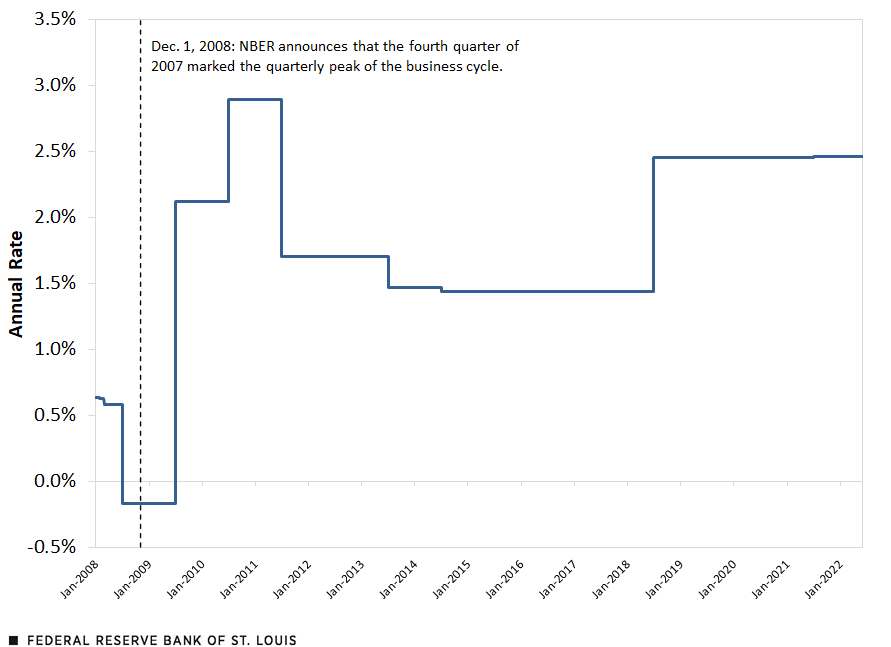
SOURCES: Bureau of Economic Analysis and ALFRED (Archival FRED).
These two examples show why the NBER looks at a range of indicators beyond the two cited in this post (like monthly industrial production and real personal consumption expenditures) and why it tends to be patient in determining peaks and troughs in economic activity: The data in real time can provide a misleading signal of the overall strength or weakness of economic activity.
Devin Werner, a senior research associate at the Federal Reserve Bank of St. Louis, contributed to this post.
Note
- See the technical note for the advance release (PDF) of the second-quarter GDP report.

This blog offers commentary, analysis and data from our economists and experts. Views expressed are not necessarily those of the St. Louis Fed or Federal Reserve System.
Email Us
All other blog-related questions
