What Drives Changes in Inflation?

Inflation has been one of the hottest topics in 2021 thus far. A variety of factors—including low interest rates, pent-up demand and stimulus checks—have sparked discussion about increased inflation as the U.S. prepares to transition into a post-pandemic economy.
As the COVID-19 pandemic commenced, the 12-month rate of personal consumption expenditures (PCE) inflation dipped substantially, falling from 1.8% in February 2020 to 0.5% in April 2020. Since then, the inflation rate has largely trended upward, clocking in at 2.3% for March 2021 (the most recent data published).This higher-than-usual inflation rate is due in part to the fact that the personal consumption expenditures price index dropped in March and April 2020, thus the year-over-year percent changes for March and April 2021 will be distortedly high.
The prices for goods and services, however, do not all change at the same rate. In this blog post, we examine the inflationary trends of different components of the PCE price index (PCEPI) over the previous two economic expansions,The previous two economic expansions are defined as November 2001 to December 2007 and June 2009 to February 2020 by the NBER. We calculated average expansion inflation rates over the periods November 2002-December 2007 and June 2010-February 2020 so as to exclude residual extreme values from the preceding recession periods. as well as how each component has contributed to recent inflation dynamics.
Breaking Down the PCEPI
Produced monthly by the Bureau of Economic Analysis, the PCEPI reflects the prices consumers in the United States pay for goods and services; the PCE inflation rate is the percentage change in the index.There are two price indices commonly used to measure inflation in the U.S.: the personal consumption expenditures price index from the Bureau of Economic Analysis and the consumer price index from the Bureau of Labor Statistics. These indices differ in their construction methodology and scope of coverage. The Federal Reserve uses PCE data to gauge its 2% inflation target. We use PCE inflation data from November 2002 to March 2021.
The PCEPI comprises three main components:
- Durable goods (e.g., long-lasting products such as household items and motor vehicles)
- Nondurable goods (e.g., clothes and gasoline)
- Services (e.g., health care and housing expenditures)
Inflation Trends across PCE Components
Durable Goods
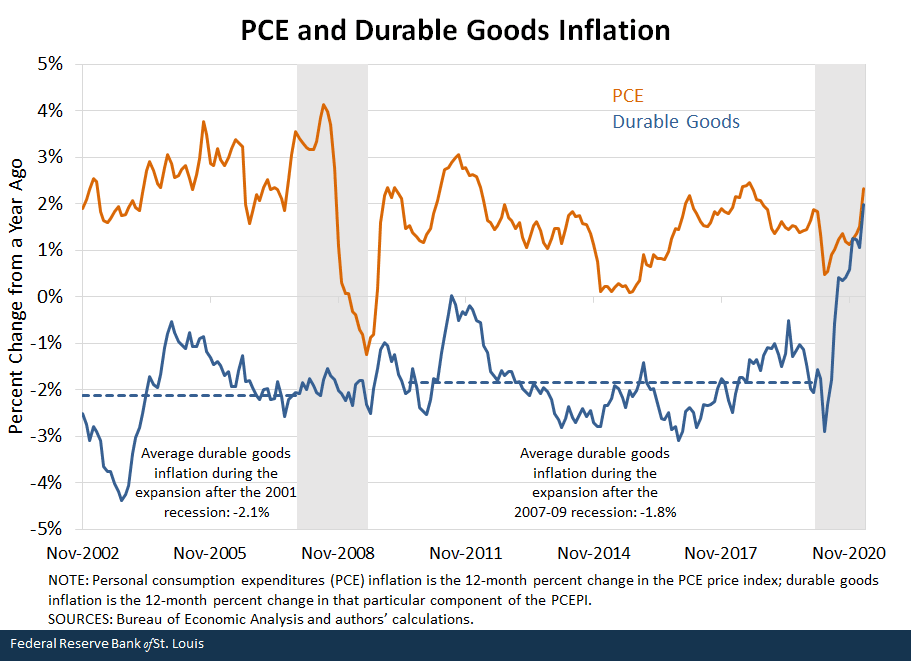
The figure below shows the durable goods inflation rate and the overall PCE inflation rate. For most of the sample period, durable goods inflation was negative (deflation), and the average inflation rate held fairly steady across the previous two expansions. These negative inflation rates indicate that prices for durable goods have generally been falling over the previous two decades.
Since April 2020, however, there has been a sharp uptick in the durable goods inflation rate, which has contributed to the recent increase in the overall PCE inflation rate. Pandemic-related supply chain disruptions for inputs such as automobile parts and computer chips drove up the prices for many durable goods in recent months. These price increases are likely to be transitory, though, and durable goods inflation rates are expected to fall as supply chains resume their normal flow.
Nondurable Goods
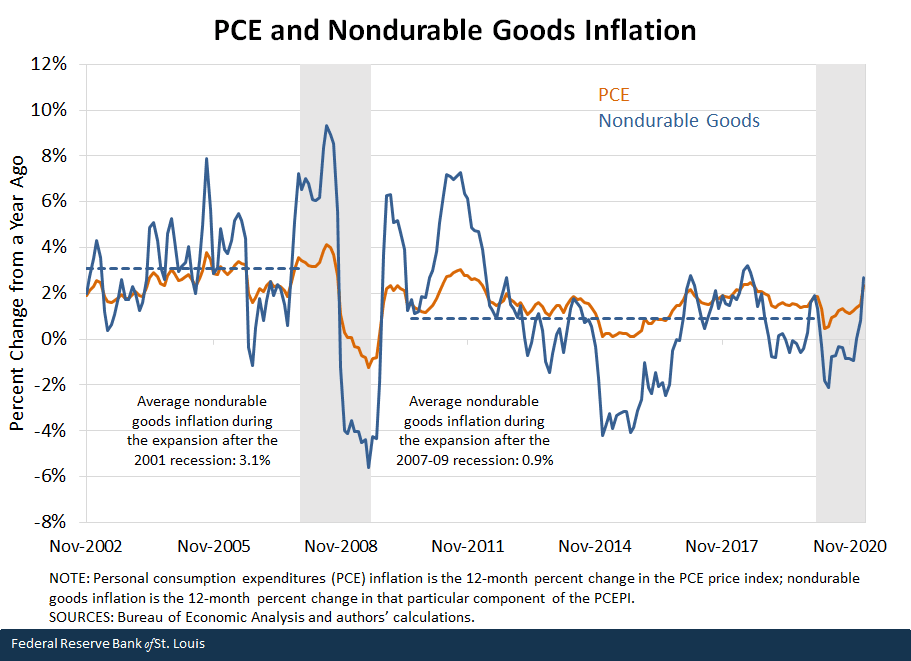
The next figure displays the nondurable goods inflation rate and the overall PCE inflation rate. The average nondurable goods inflation rate dropped substantially from the 2001-07 expansion (3.1%) to the 2009-20 expansion (0.9%). This decline contributed to overall lower inflation during that most recent expansion.
As evidenced by the figure, nondurable goods inflation is quite volatile, driven largely by fluctuations in gasoline and energy prices. At the beginning of the pandemic, the nondurable goods inflation rate dipped with the decline in gasoline and energy prices, but the rate has since increased as those prices have rebounded.
Services
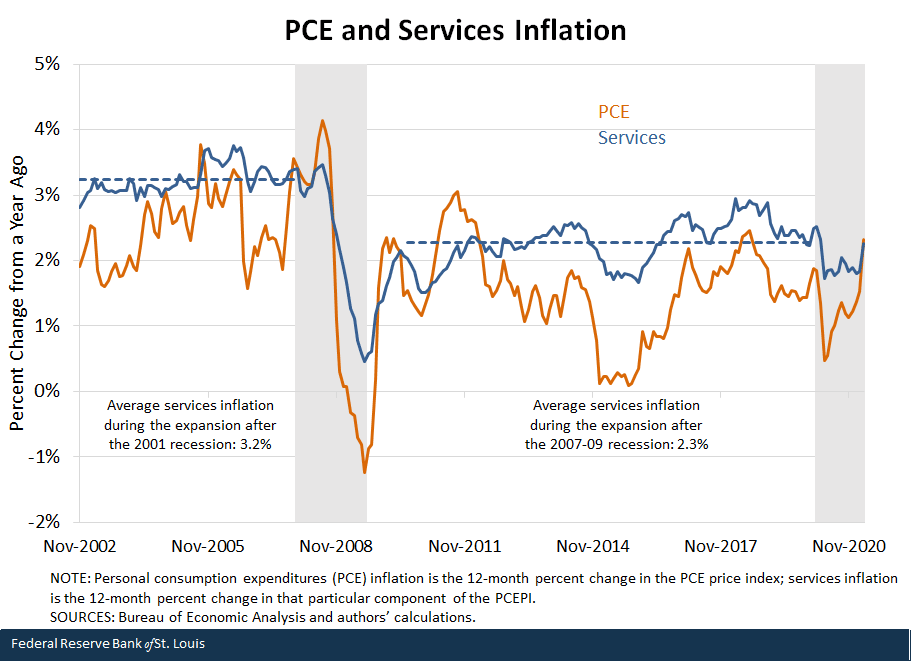
The figure below displays the services inflation rate and the overall PCE inflation rate. Over the last two decades, prices for services have generally increased at a higher rate than the other PCE components. That rate, however, dropped considerably following the Great Recession (2007-09), and the average services inflation rate in the second expansion was about one percentage point lower than in the first. As the pandemic commenced, the services inflation rate dipped a bit, but since that initial dip the rate has generally trended upward.
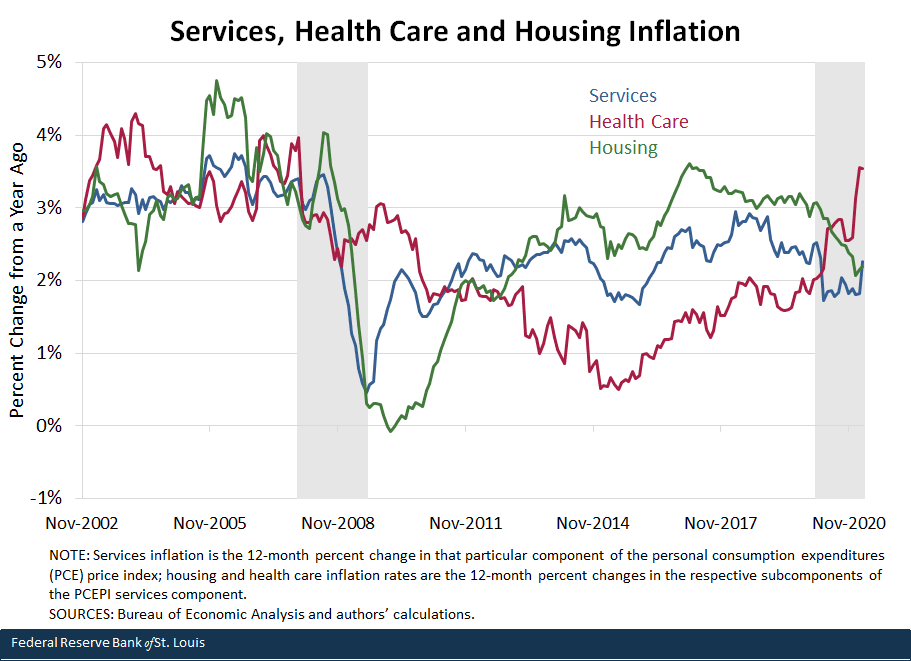
The PCE services component comprises subcomponents such as housing, health care, transportation, recreation, financial services, as well as food and accommodation. The figure below shows the inflation trends for the two subcomponents with the largest expenditure shares: health care and housing.
Since 2016, the health care inflation rate has mostly risen. Meanwhile, the housing inflation rate (which is calculated using rent prices) has declined. However, home prices have surged in recent months with a hot housing market, and rent prices might follow suit; this means that the housing inflation rate could start to rise in coming months, thus increasing the services and the overall PCE inflation rates.
The importance of these two subcomponents cannot be understated. Housing and health care constitute services for basic necessities; if inflation rates for these categories rise substantially in the coming months, concerns may surface regarding the affordability of these services for low-income households, particularly if wages do not rise at the same rate.
As we track how the overall inflation rate changes in the coming months, it will also be important to identify what components of the PCEPI are driving those changes, why we observe those inflation dynamics, and how price patterns may impact various demographics of the population.
Notes and References
- This higher-than-usual inflation rate is due in part to the fact that the personal consumption expenditures price index dropped in March and April 2020, thus the year-over-year percent changes for March and April 2021 will be distortedly high.
- The previous two economic expansions are defined as November 2001 to December 2007 and June 2009 to February 2020 by the NBER. We calculated average expansion inflation rates over the periods November 2002-December 2007 and June 2010-February 2020 so as to exclude residual extreme values from the preceding recession periods.
- There are two price indices commonly used to measure inflation in the U.S.: the personal consumption expenditures price index from the Bureau of Economic Analysis and the consumer price index from the Bureau of Labor Statistics. These indices differ in their construction methodology and scope of coverage. The Federal Reserve uses PCE data to gauge its 2% inflation target.
Additional Resources
- On the Economy: Is Inflation Making a Comeback?
- On the Economy: Market-Based Measures of Inflation Risks
- On the Economy: How Well Do Consumers Forecast Inflation?
Citation
YiLi Chien and Julie Bennett, ldquoWhat Drives Changes in Inflation?,rdquo St. Louis Fed On the Economy, May 27, 2021.
This blog offers commentary, analysis and data from our economists and experts. Views expressed are not necessarily those of the St. Louis Fed or Federal Reserve System.
Email Us
All other blog-related questions


