


How Well Do Consumers Forecast Inflation?

Every month, the University of Michigan conducts the Surveys of Consumers, asking regular people about their outlook on current and future economic conditions.More information on the survey and sampling design can be found on its data page. The results of the survey help assess how the average consumer processes economic data in forming expectations of future outcomes.
Questions in this survey include:
- During the next 12 months, do you think that prices in general will go up, or go down, or stay where they are now?
- By what percent do you expect prices to go (up/down) on the average, during the next 12 months?The Surveys of Consumers Questionnaire can be found on the survey’s information page.
Using responses to these questions, the University of Michigan constructs a data series of consumers’ median expectations of year-over-year inflation.For specifics on how this series is constructed, see the 1996 document “Procedure to Estimate Price Expectations (PDF).”
Consumers and Forecasting Inflation
How proficient are consumers at forecasting the inflation rate one year ahead? We can evaluate this by comparing consumers’ median inflation expectations and the year-over-year consumer price index (CPI) inflation rate.The CPI year-over-year inflation rate for any given month is calculated as the percent change in the price level over the previous 12 months. It reflects how much average prices have changed relative to the same time the previous year. For the period 1984 to present,This time frame was chosen as it reflects the start of the Great Moderation until present. The Great Moderation, which ended in 2007, marked a period of stable prices and reduced macroeconomic volatility. the figure below compares:
- The year-over-year CPI inflation rate as reported by the Bureau of Labor Statistics
- Consumers’ median inflation forecast from the survey 12 months before
- Consumers’ median inflation forecast from the current survey month
For example, for the month of January 2021, the data point on the orange line is the percent change in the level of the CPI from January 2020 to January 2021. The data point on the dotted blue line is the forecast from the January 2020 survey and reflects what consumers expected inflation to be over the year from January 2020 to January 2021. And the data point on the gray line is the forecast from the survey conducted in January 2021 and reflects consumers’ expectations of what inflation will be over the year from January 2021 to January 2022. Thus, the blue and gray lines reflect the same data, but the blue line is shifted forward 12 months so we can evaluate how accurate consumer expectations were a year ago compared with the actual values.
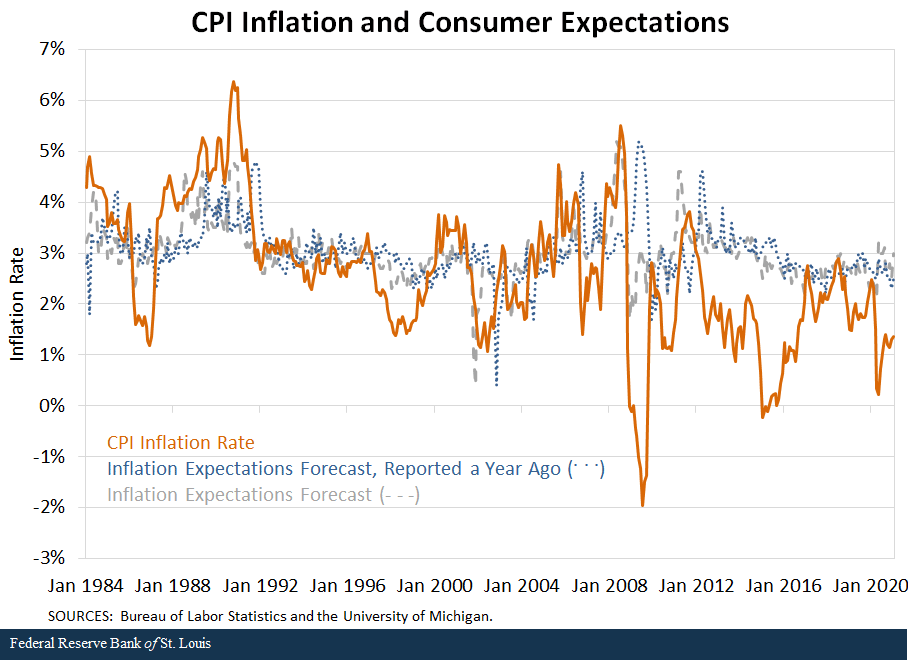
Notice that the year-earlier forecast (blue line) and the CPI inflation rate (orange line) do not track each other very well. Indeed, the correlation between these two is negligible, about 0.08. (A reading of 1.0 indicates a perfect positive relationship between two variables, and 0.0 indicates no relationship.)
Professional forecasters use data, predictive models and often judgment to make inflation forecasts. Perhaps not surprisingly, they have been found to perform better at forecasting inflation.For more information, see Lloyd Thomas’ 1999 Journal of Economic Perspectives article “Survey Measures of Expected U.S. Inflation.”
How Do Consumers Estimate Inflation?
If professional forecasters use sophisticated models, what do consumers base their forecasts on? Consumers might base their inflation forecasts, in part, on current price changes/inflation rates. Without a sophisticated model, consumers may guess what will happen tomorrow (or even one year from now) by assessing what is happening today.
Indeed, the correlation between the CPI inflation rate in a given month and consumer inflation expectations surveyed concurrently proves much stronger, at 0.64. A 2001 paper from Andrew Atkeson and Lee Ohanian refers to this forecasting framework as a naive model of inflation forecasting, and they use it as a benchmark by which to gauge other, more complex forecasting models.For more information, see Atkeson and Ohanian’s paper “Are Phillips Curves Useful for Forecasting Inflation?”
This framework appears to perform well during stretches of time where the inflation rate is less volatile. For instance, inflation stayed fairly constant in the mid-1990s, and consumer inflation forecasts tracked the actual CPI inflation rate pretty closely.
Meanwhile, when inflation is more volatile, this framework appears to perform poorly. For example, prior to the Great Recession, the actual CPI inflation rate spiked, and consumer inflation expectations surveyed at the time followed that trend closely. Those expectations, however, served as the inflation forecasts for the start of the Great Recession when the inflation rate plummeted; thus, we observe large forecast errors during that time frame.
Notes and References
- More information on the survey and sampling design can be found on its data page.
- The Surveys of Consumers Questionnaire can be found on the survey’s information page.
- For specifics on how this series is constructed, see the 1996 document “Procedure to Estimate Price Expectations (PDF).”
- The CPI year-over-year inflation rate for any given month is calculated as the percent change in the price level over the previous 12 months. It reflects how much average prices have changed relative to the same time the previous year.
- This time frame was chosen as it reflects the start of the Great Moderation until present. The Great Moderation, which ended in 2007, marked a period of stable prices and reduced macroeconomic volatility.
- For more information, see Lloyd Thomas’ 1999 Journal of Economic Perspectives article “Survey Measures of Expected U.S. Inflation.”
- For more information, see Atkeson and Ohanian’s paper “Are Phillips Curves Useful for Forecasting Inflation?”
Additional Resources
- Regional Economist: Does Low Unemployment Signal a Meaningful Rise in Inflation?
- On the Economy: Rising Inflation Doesn’t Impact Everyone the Same
- Economic Synopses: How Accurate Are Measures of Long-Term Inflation Expectations?
Citation
Michael T. Owyang and Julie Bennett, ldquoHow Well Do Consumers Forecast Inflation?,rdquo St. Louis Fed On the Economy, March 22, 2021.
This blog offers commentary, analysis and data from our economists and experts. Views expressed are not necessarily those of the St. Louis Fed or Federal Reserve System.
Email Us
All other blog-related questions