


COVID-19 across Counties with Different Pre-Pandemic Financial Distress

An April 2020 blog post determined that the first wave of COVID-19 was primarily affecting people living in areas where most households were not in financial distress. Later updates of these data, however, showed the opposite during the second wave. Here we show evidence that while the relative number of COVID-19 infections has become, over time, more similar across areas with differing financial distress, the relative number of COVID-19 fatalities have not.
Analyzing the impact of COVID-19 on regions with differing incidence of financial distress is important. As shown in a recent working paper (PDF), communities where a higher percentage of people are financially distressed can be expected to suffer directly as they cut their spending by much more in reaction to economic shocks, such as a decline in house prices, than those that have a lower percentage of distress. The communities with higher distress also suffer further as those cutbacks intensify local economic hardship.
Financial Distress and Infections
Our data cover 98.4% of confirmed COVID-19 cases and 98.0% of confirmed COVID-19 deaths. Financial distress is measured by the portion of households in each county that were at least 30 days delinquent on bank card debt in 2018, i.e., pre-pandemic. The first quintile contains the counties with the least financially distressed households by this measure. In contrast, the fifth quintile contains the counties with the most financially distressed households. (The five groups of counties are divided so that each group has the same number of people.)
The figure below shows the share of total COVID-19 cases over time for each quintile of financial distress, starting on March 9, 2020, the date when total cases reached 1 in 100,000 people in the U.S.
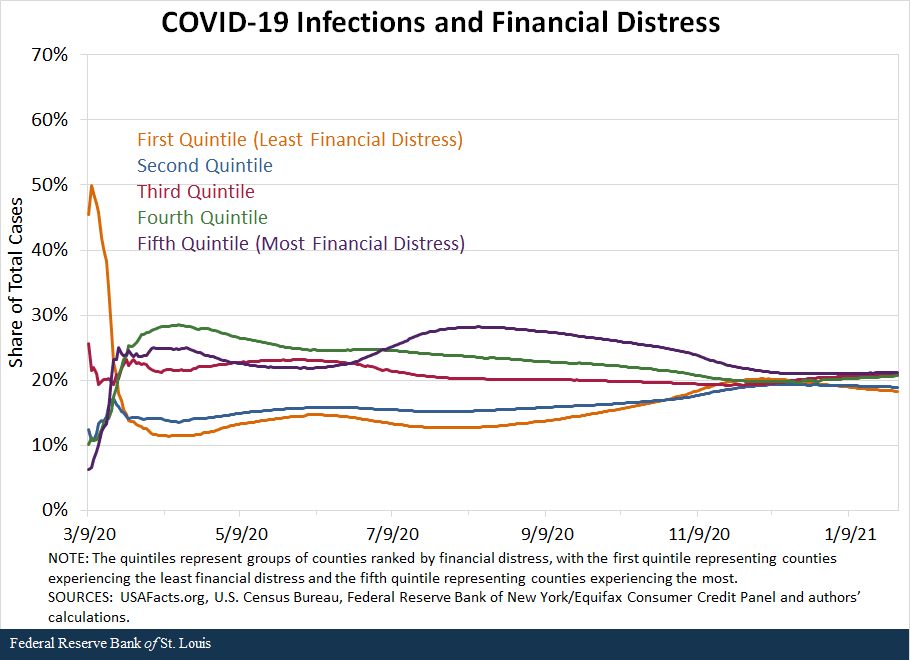
Perhaps surprisingly, the initial wave of infections primarily burdened counties with the lowest levels of financial distress. However, this pattern soon reversed as COVID-19 began infecting people in counties with higher levels of financial distress at higher rates.
In recent months, all quintiles of financial distress have begun converging in their share of total cases. As of Jan. 28, 2021, 18% of all cases were from the first quintile, 19% of all cases were from the second quintile, and the remaining quintiles each had 21% of total cases. COVID-19 infections are now everyone’s problem.
Financial Distress and Fatalities
What about deaths, though? The figure below shows each quintile’s share of COVID-19 fatalities. The figure begins on March 17, 2020, which is the date when total cases reached nearly 1 in 10,000 people in the U.S.
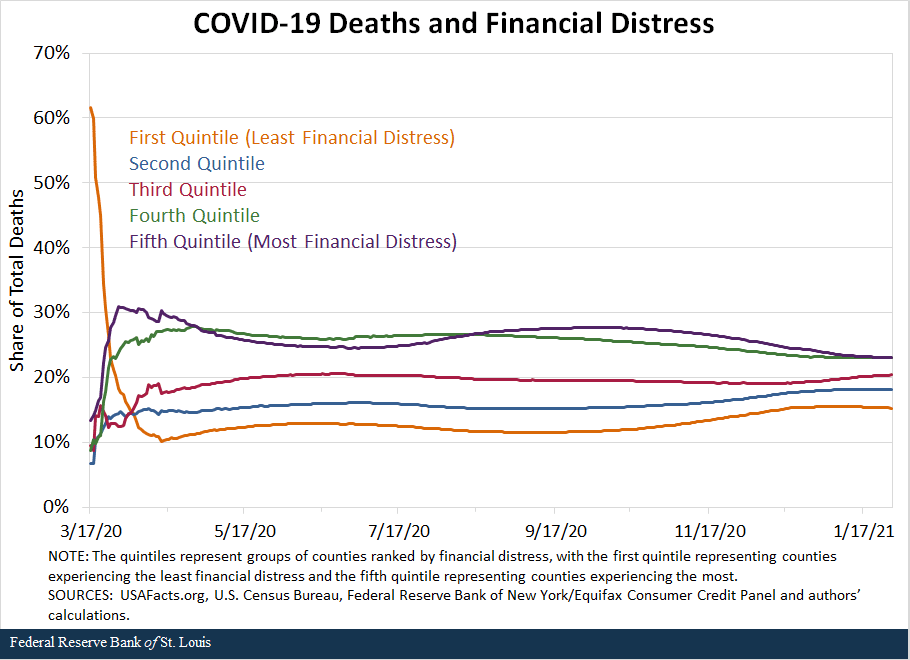
We see that unlike infections, the shares of total deaths have not converged to the same extent. According to the most recent data used here, the first quintile (least financially distressed) had approximately 15% of total deaths, whereas the fourth and fifth quintiles (most financially distressed) each had approximately 23% of total deaths.
The difference in mortality across different regions may be due to other variables that correlate with financial distress. For example, it is well known that money matters for life expectancy in the U.S. As shown in Table 1 of Kartik Athreya, Ryan Mather, José Mustre-del-Río and Juan Sánchez’s 2019 working paper (PDF), income and wealth per household fall sharply as financial distress increases. Thus, it may be that differences in COVID-19 mortality will persist, as they do with other causes of death and as they have since the onset of the pandemic.
Additional Resources
- St. Louis Fed’s COVID-19 resource page
- On the Economy: Financial Distress and the Second Wave of COVID-19 Infections
- On the Economy: COVID-19 and Financial Distress: Employment Vulnerability
Citation
Juan M. Sánchez, José Mustre-del-Rio and Kartik Athreya, ldquoCOVID-19 across Counties with Different Pre-Pandemic Financial Distress,rdquo St. Louis Fed On the Economy, Feb. 15, 2021.
This blog offers commentary, analysis and data from our economists and experts. Views expressed are not necessarily those of the St. Louis Fed or Federal Reserve System.
Email Us
All other blog-related questions