COVID-19 and Financial Distress: Vulnerability to Infection and Death
The following is the second post in a series examining the potential impact of COVID-19 on workers in areas already experiencing higher levels of financial distress.
In part one of this series, we explored how the economic effects of social distancing and “shelter in place” orders will harm people to different extents based upon their jobs, with certain jobs more likely to face layoffs and reduced wages than others. In particular, we illustrated that people working in the “Accommodation and Food” sector—which employs close to 10% of the workforce—were most often located in areas of highest financial distress.
Social distancing policies are being pursued despite their economic consequences because policymakers view the potential harm of COVID-19 infections spreading unchecked to be still greater. In this post, we will examine the association between infections and deaths from COVID-19 and observed incidence of financial distress.
Becoming sick—especially with a disease as serious as COVID-19—is associated with many economic effects. People may have to take time off work, find alternative childcare and face medical bills—possibly without adequate health insurance. All of these effects are compounded if the sick individuals are already in financial distress, because they will have less ability to make the associated payments by drawing down on savings or taking on additional loans.As mentioned in the previous post, we showed in a recent working paper that communities with a higher percentage of people in financial distress will cut their consumption much more in reaction to an economic shock than communities where a lower percentage of people are financially distressed.
Measuring Financial Distress and COVID-19
To better understand how COVID-19 is associated with financial distress, we employed two datasets. First, we used county-level data on confirmed COVID-19 cases and deaths compiled by USAFacts.org from the CDC, Johns Hopkins University, and state and local agencies. These data were then merged with 2018 county population estimates from the U.S. Census Bureau to calculate the approximate percentage of the total population that COVID-19 cases represent.2018 is the most recent year available for these data.
Second, using the Federal Reserve Bank of New York/Equifax (CCP) dataset, we calculated the share of people in each county whom we would consider to be “financially distressed.” For this, we proceeded as we had in our previous post: We considered someone who is delinquent 30 days or more on a credit card payment over the course of a year to be distressed. Difficulty in making timely payments is a good indicator of overall financial capacity.
We divided all U.S. counties into five groups—or “quintiles"—defined by the incidence of financial distress, so that each group has the same number of people. Counties with the lowest financial distress are in group one, while counties with the highest financial distress are in group five.
Financial Distress and COVID-19 Infections

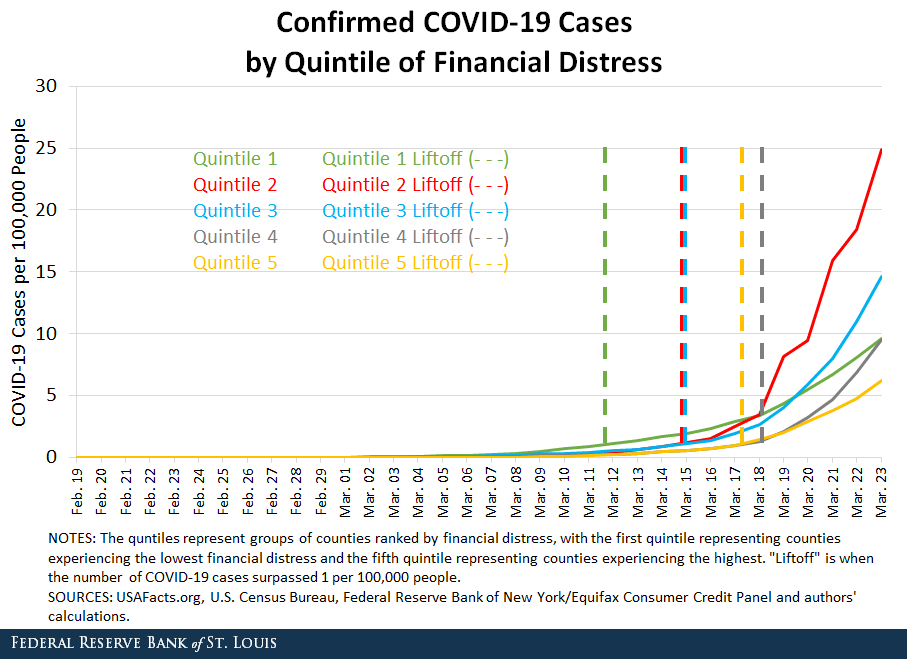
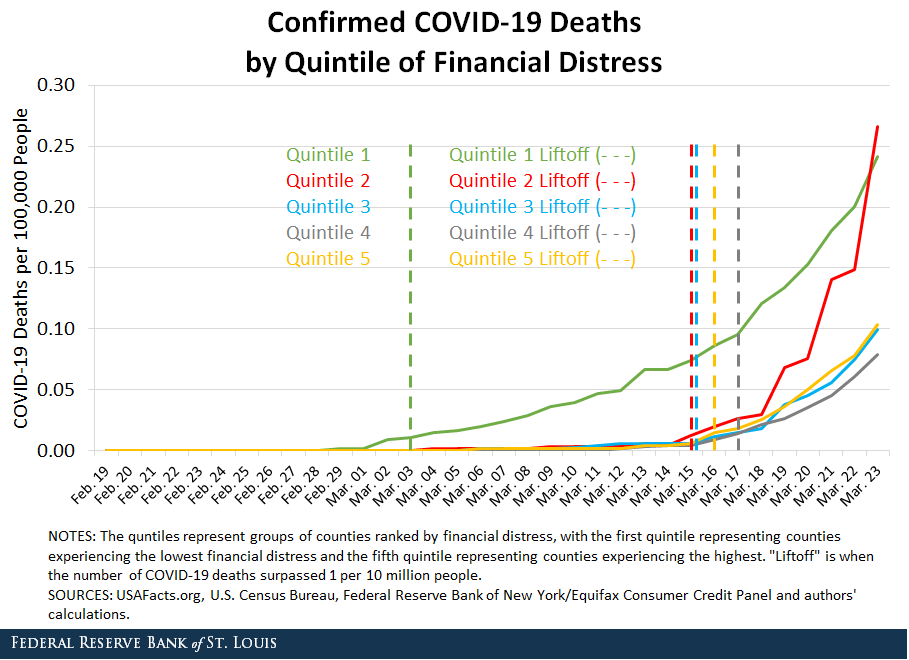
The figure above plots the portion of the population confirmed to be sick with COVID-19 for each quintile of financial distress. The vertical lines of a matching color show the “liftoff” point when the exponential growth of coronavirus cases began.Specifically, we set this threshold at 1 in 100,000 people for the first figure and 1 in 10 million for the second figure. Remarkably, the liftoff in each area occurs in order of financial distress. Areas with the least financial distress seem to have been hit first, while areas with greater financial distress were hit later.
There could be any number of reasons for this, but one possibility is that people with lesser financial distress tend to be wealthier, more urbanized (and, hence, densely located) and apt to travel more for their jobs or recreation. This effect could be compounded if financially stable people spend their time in communities of similar people who also travel around the world more frequently, which is why it is relevant that our metric of financial distress is taken at the level of entire counties.
Although areas with low financial distress have been the first to lift off, this does not imply that they always have more cases than the other quintiles. Around March 18, the second quintile surpassed the first. Since then, the third quintile has also done so, and the fourth quintile had just reached the first on the last day we plotted. At this point, any conclusions that we can draw are speculative, but it is interesting to consider why the other quintiles seem to be growing faster than quintile one after their initial liftoff dates.
One reason could be that communities with lower levels of financial distress are more effectively able to pursue social distancing and slow the spread of the virus. Indeed, as noted in our first post, the larger share of people in financially distressed areas worked in sectors that are most vulnerable to a shock that keeps people from gathering—particularly in the Accommodation and Food arena in which relatively high contact with clientele is the norm. It could also be that people who are more financially prudent have better access to timely information on risks, enabling them to take extra health precautions.
Financial Distress and COVID-19 Deaths

The figure above shows the corresponding death rates by quintile. Here as well, the liftoff points seem to be closely correlated with financial distress, with areas of lower financial distress seeing deaths related to COVID-19 sooner. At this point, only the second quintile has surpassed the first quintile, which may be because the death rate necessarily lags the rate at which coronavirus spreads. Put grimly, in order to die from COVID-19, someone must first contract it. It is also true that areas with low financial distress tend to be slightly older, and the death rate among the elderly appears thus far to be far higher than among other age groups.
The Impact of Selective Testing
One possible bias that may well prove important in interpreting the data above is that our results depend on data stemming from (thus far, very) selective testing for COVID-19. At one extreme, if no testing for COVID-19 is being done in an area, then our data will show no cases for that region even if the entire population is sick. And if those who are better off—that is, those in communities with low financial distress—are also more likely to get themselves tested, this will artificially inflate the number of coronavirus cases in that region. With this bias in mind, it is perhaps even more surprising that we observed the number of cases in the second, third and fourth quintiles at or above those in the first quintile of financial distress.
Moreover, deaths by COVID-19 are unlikely to be selectively reported. Thus, the very similar trends seen in the figures suggest our broad conclusions are not being severely affected by the biases present in the current testing protocol.
That noted, the broader implication of this lack of random testing is that it hinders good policymaking. After all, the consequences of a shutdown of economic activity depend heavily on how likely it is that an infected person gets seriously ill or dies. However, as conveyed by Harvard economics professor James Stock, to know this we must first learn how big the asymptomatic population is.Stock, James H. “Random Testing Is Urgently Needed.” IGM Forum, March 23, 2020. This cannot be known until genuinely randomized testing is done, making such testing an urgent priority for policymakers to measure the benefits that they are reaping from strict social distancing guidelines.
Conclusion
In conclusion, it seems that COVID-19 has spread most quickly in areas with low financial distress initially, but evidence suggests that COVID-19 may spread most rapidly in highly financially distressed areas moving forward. If this is true, then special consideration should be given to how the financial position of distressed communities in particular might be supported in the coming relief efforts.
In our next series of posts, we will examine a number of policy initiatives for providing this relief through the lens of a quantitative model, and we will give some initial guidance on which policies may have the most beneficial results.
Notes and References
1 As mentioned in the previous post, we showed in a recent working paper that communities with a higher percentage of people in financial distress will cut their consumption much more in reaction to an economic shock than communities where a lower percentage of people are financially distressed.
2 2018 is the most recent year available for these data.
3 Specifically, we set this threshold at 1 in 100,000 people for the first figure and 1 in 10 million for the second figure.
4 Stock, James H. “Random Testing Is Urgently Needed.” IGM Forum, March 23, 2020.
Additional Resources
- St. Louis Fed’s COVID-19 resource page
- Timely Topics: Financial Distress and COVID-19
- On the Economy: Financial Distress Differences Seen at the ZIP Code Level
- On the Economy: COVID-19 and Financial Distress: Employment Vulnerability
Citation
Juan M. Sánchez, ldquoCOVID-19 and Financial Distress: Vulnerability to Infection and Death,rdquo St. Louis Fed On the Economy, April 2, 2020.
This blog offers commentary, analysis and data from our economists and experts. Views expressed are not necessarily those of the St. Louis Fed or Federal Reserve System.
Email Us
All other blog-related questions


