Corporate Bond Spreads and the Pandemic III: Variance across Sectors and Firms

As the COVID-19 pandemic began spreading, we saw a marked increase in corporate bond spreads during early March. In response, Federal Reserve announcements starting March 23 contributed to stabilizing the disruptions in credit markets.See our blog post “Corporate Bond Spreads and the Pandemic.”
We documented, however, that the evolution of credit spreads is quite different across sectors. For example, sectors that are more vulnerable to social distancing measures—such as arts and entertainment, or accommodation and food services—performed worse than sectors in which containment and mitigation measures should have a smaller impact, such as manufacturing or utilities.See our blog post “Corporate Bond Spreads and the Pandemic II: Heterogeneity across Sectors.”
In this post, we dig deeper by looking at variation within sectors, firms and bond issuances. We found that there is substantial heterogeneity both across firms and across bonds for the same firm, particularly during the period of credit market disruption.
Moreover, we found a strong correlation between the increase in the sectoral credit spread and the increase in within-firm dispersion. These results imply that looking at and understanding not only the average spreads but also the variance of spreads might be important in understanding the evolution of credit markets.
First and Second Moments
We divided 2020 into three periods:
- First, the “pre-COVID-19” period, before financial market instability started around Feb. 28
- Second, the “pre-intervention” period, before financial market volatility and instability were curbed by Fed interventions in these markets on March 23
- Finally, the period after the March 23 interventions
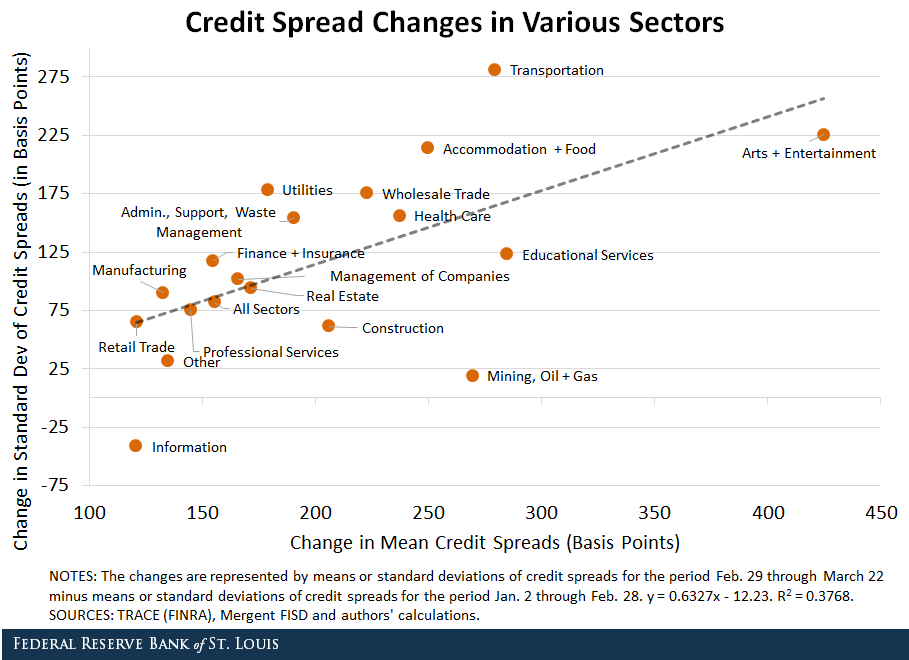
The figure below examines the evolution of credit spreads between the first and second periods. The figure shows the change in the average spread in each sector (on the x-axis) versus the change in the standard deviation of credit spreads in each sector (on the y-axis) between these two periods.More concretely, we started with a daily panel of corporate bond spreads as in our previous blog posts and computed the standard deviation of those spreads over the Jan. 2–Feb. 28 and Feb. 29–March 22 periods. The change is then the difference between the standard deviation in the latter and the former periods. The daily corporate bond spreads correspond to the average credit spread over all transactions in a single day. Thus, our analysis abstracts from intraday variation in bond spreads across transactions. For an analysis of intraday corporate bond liquidity during the same period that complements ours, see the working paper “Corporate Bond Liquidity During the COVID-19 Crisis.”

There is a tight correlation between the change in first and second moments across sectors: Sectors that experienced larger increases in average credit spreads also tended to display larger increases in the variance of those spreads.
Next, we try to understand where this relationship is coming from.
Decomposing the Second Moment
We decomposed the variance of credit spreads into variation at three different levels:
- Variation across sectors
- Variation across firms, within sector
- Variation across bonds, within each firm and sector
In the table below, we report the relative contribution of each component to the total variance in credit spreads within the three periods.
| Across Sectors | Across Firms | Within Firm | |
|---|---|---|---|
| Jan. 2 to Feb. 28 | 0.13 | 0.69 | 0.18 |
| Feb. 29 to March 22 | 0.11 | 0.47 | 0.42 |
| March 23 to April 24 | 0.12 | 0.64 | 0.24 |
| SOURCES: TRACE (FINRA), Mergent FISD and authors' calculations. | |||
First, the variation across sectors has a small and relatively constant contribution, explaining between 11% and 13% of the overall dispersion. Second, the contribution of variation across bonds of the same firm increased considerably during the pre-intervention period (from 18% to 42%) at the expense of a reduction in the variation across firms (from 69% to 47%).
This decomposition suggests that most of the increase in variance during the second period happened across bonds issued by the same firm and not so much across firms.
In other words, it is not that some firms’ or sectors’ credit spreads were rising considerably more than those of other firms or sectors. Instead, secondary market prices of bonds issued by the same firms were becoming more disperse.
The Second Moment Across Sectors
Sectors with larger increases in average spreads also registered larger increases in the standard deviation of those spreads. Is this correlation associated with increases in dispersion across or within firms?
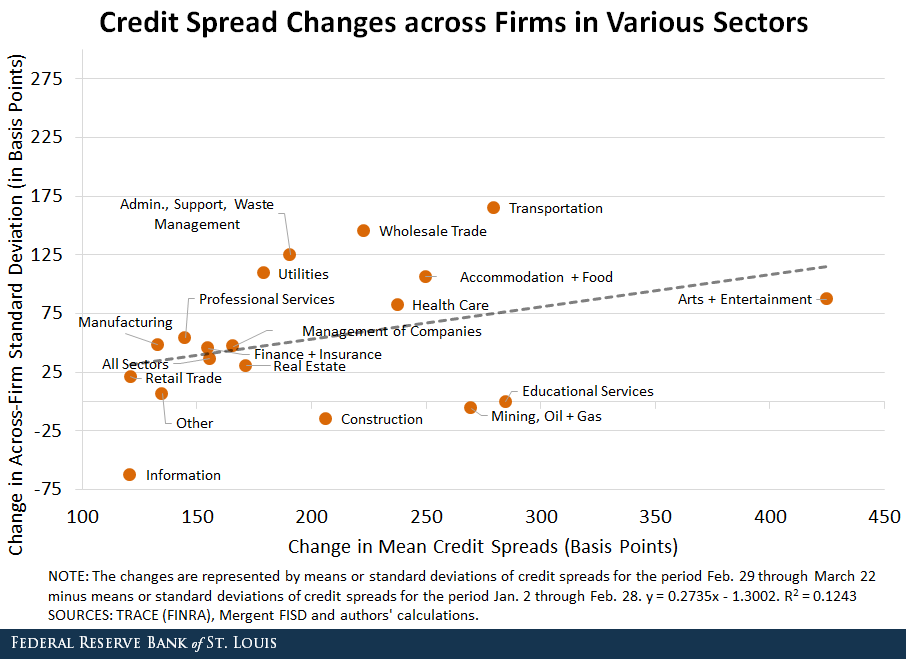
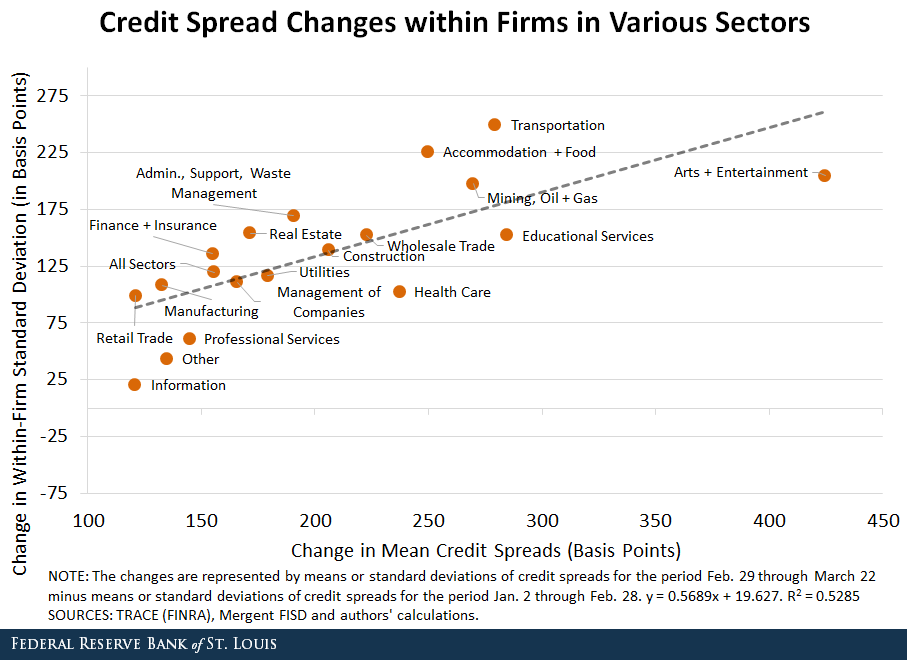
The figures below study how credit spreads changed in the second period across sectors. The first figure below plots the change in the variation across firms against the change in the average spread of the sector (as in the first figure in this post). The second figure plots the change in the variation of the within-firm component also against the change in the average spread of the sector.


While both components are positively related to the average spread, the correlation is much stronger for the variation across issuances within firms. This means that sectors with larger increases in credit spreads tended to register larger increases in dispersion across spreads of bonds issued by the same firm and smaller increases (though still increases) in dispersion of average spreads for different firms.
How should these results be interpreted? Pure credit risk should be the same for all bonds issued by a single firm (as we are focusing on bonds of equal seniority). For this reason, an increase in the dispersion of credit risk should be reflected in the across-firm component.
Instead, we found that the increase in average spreads is related to the within-firm component that may be related to other factors, such as the decrease in liquidity documented in the working paper “Corporate Bond Liquidity During the COVID-19 Crisis.”
Notes and References
1 See our blog post “Corporate Bond Spreads and the Pandemic.”
2 See our blog post “Corporate Bond Spreads and the Pandemic II: Heterogeneity across Sectors.”
3 More concretely, we started with a daily panel of corporate bond spreads as in our previous blog posts and computed the standard deviation of those spreads over the Jan. 2–Feb. 28 and Feb. 29–March 22 periods. The change is then the difference between the standard deviation in the latter and the former periods. The daily corporate bond spreads correspond to the average credit spread over all transactions in a single day. Thus, our analysis abstracts from intraday variation in bond spreads across transactions. For an analysis of intraday corporate bond liquidity during the same period that complements ours, see the working paper “Corporate Bond Liquidity During the COVID-19 Crisis.”
Additional Resources
Citation
Julian Kozlowski and Mahdi Ebsim, ldquoCorporate Bond Spreads and the Pandemic III: Variance across Sectors and Firms,rdquo St. Louis Fed On the Economy, May 11, 2020.
This blog offers commentary, analysis and data from our economists and experts. Views expressed are not necessarily those of the St. Louis Fed or Federal Reserve System.
Email Us
All other blog-related questions


