Corporate Bond Spreads and the Pandemic II: Heterogeneity across Sectors
In a previous blog post, we explored the evolution of movements of corporate bond spreads since the beginning of the year. We found a marked rise both in the median and the standard deviation of corporate bond spreads between Jan. 2 and March 23. Most of the increase happened since the end of February, when financial markets started internalizing the possibility that the pandemic and subsequent policy response would have deep economic consequences.
The rise in credit spreads came to a halt on March 23, as the Federal Reserve deployed a series of liquidity assistance programs aimed at the corporate bond market. At the time of this writing, credit spreads have fallen compared to their peak but are still nowhere near their pre-pandemic levels.
In this blog post, we analyze the increase in the dispersion of credit spreads by looking at their evolution by sector. In particular, we analyze which sectors were more affected by both the pandemic shock and the effects of the Fed’s liquidity interventions.
Rise and Fall of Credit Spreads by Sector
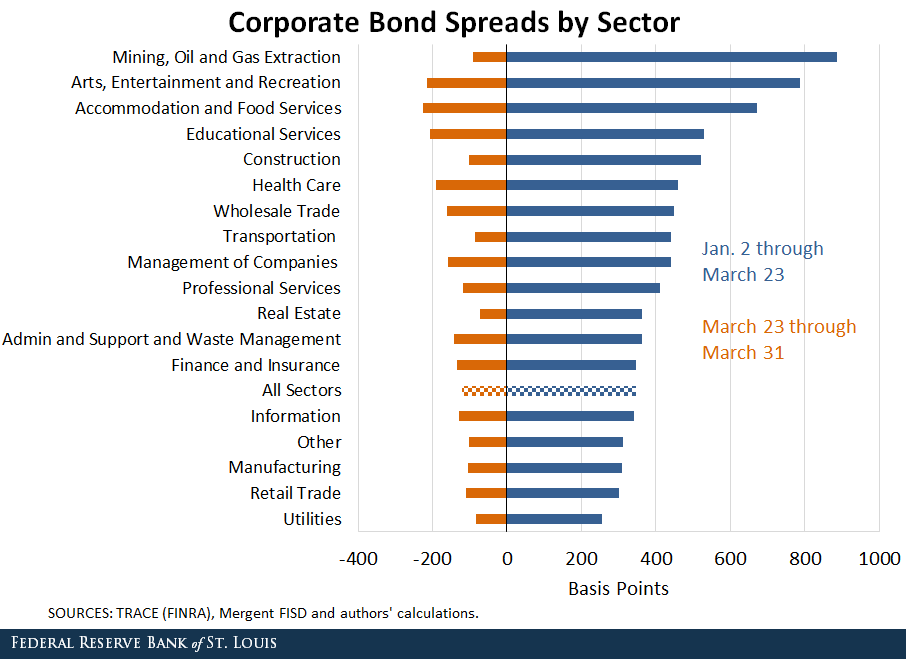
Corporate spreads had been rising until the Fed’s intervention and decreased thereafter. These dynamics, however, are not uniform across sectors. The figure below plots the median pre-March 23 increase (blue bars to the right) and the post-March 23 decrease (orange bars to the left) in corporate bond spreads by major sector (two-digit NAICS).We computed credit spreads by taking information on prices at which bonds are traded from TRACE (FINRA) and combining it with information on bond-level characteristics from Mergent FISD. This follows the methodology used in Gilchrist, Simon; and Zakrajsek, Egon. “Credit Spreads and Business Cycle Fluctuations.” American Economic Review, June 2012, Vol. 102, No. 4, pp. 1692-720. We computed the average spreads by sector in a three-day window around Jan. 2, March 23 and March 31. On average, each sector has 833 transactions, 360 bonds and 71 firms. Those sectors are sorted from top to bottom according to the pre-March 23 increase in median spread.

There are several interesting observations. First, there is substantial heterogeneity in the initial increase in credit spreads (represented by the size of the blue bars). The most affected sector was Mining, Quarrying, and Oil and Gas Extraction. While this sector is not directly exposed to the pandemic shock per se, it has been affected by other factors such as the recent drop in oil prices and expectations of lower global demand for oil due to the pandemic shock.
Second, some of the most affected sectors—such as the Arts, Entertainment and Recreation and the Accommodation and Food Services sectors—are directly impacted by the shutdown and social distancing measures. The Manufacturing, Utilities and Information sectors have been much less affected by the shock. This reflects that some sectors have been more affected by the “pandemic shock” than others.
Finally, while there was substantial heterogeneity in the initial increase in credit spreads, the decrease in credit spreads after March 23 seems to be more uniform across sectors. The standard deviation of the initial increase is more than three times larger than the standard deviation of the subsequent decrease.
This might reflect the fact that most of the Fed’s policy actions were not targeted at specific sectors, but rather were available to the corporate bond market as a whole. Thus, it seems that all sectors have similar benefits from these measures, even though they are affected by the shock in different ways.
High vs. Low Contact-Intensity Industries
In a recent blog post, Fernando Leibovici, Ana Maria Santacreu and Matthew Famiglietti classified industries in the U.S. according to their degree of contact intensity. The idea is that high contact-intensity industries—such as personal care services or air transportation—are most directly affected by social distancing measures and will therefore be more exposed to the pandemic shock.
Leibovici, Santacreu and Famiglietti produced a measure of physical proximity for each sector. We used this physical proximity index to divide sectors into two groups: high contact-intensity sectors and low contact-intensity sectors. We defined “high-contact” sectors as having physical proximity indexes greater than or equal to 60 and “low-contact” as the converse. The high-contact industries are Construction, Retail Trade, Transportation, Education, Health Care, Arts and Entertainment, and Accommodation and Food Services.
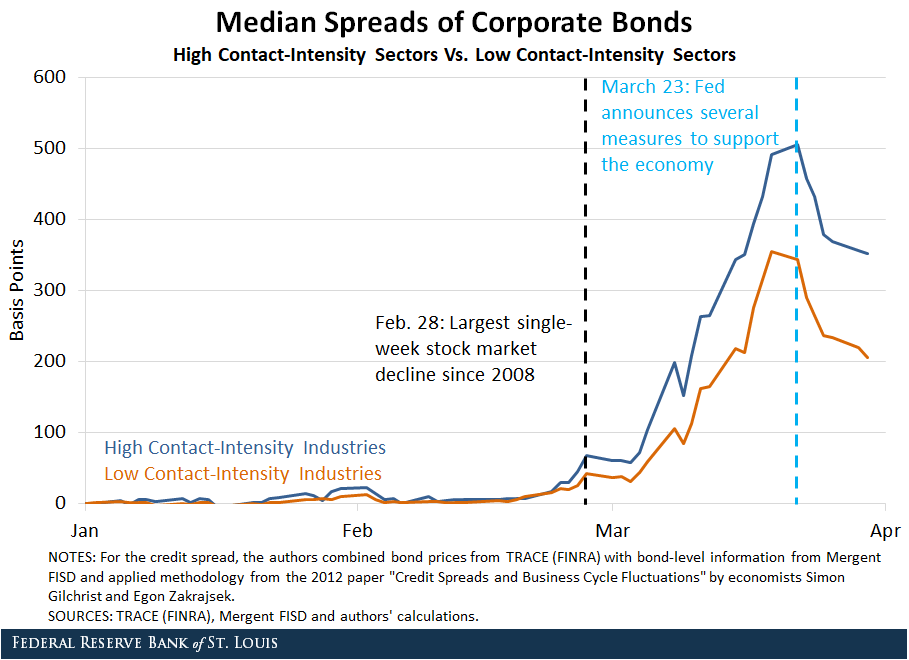
The figure below plots the median spread in each group (normalized by the median spread for that group in the beginning of the year).

Indeed, credit spreads for high-contact sectors tended to rise by more in the run-up to the Fed’s interventions.
Credit spreads for low-contact sectors also increased during this period, which might be related to the input-output linkages with the high-contact sectors. As Leibovici, Santacreu and Famiglietti noted, sectors that are low contact-intensive either supply intermediate goods to or use intermediate goods from contact-intensive sectors. Hence, a shock to contact-intensive sectors may propagate to the rest of the economy.
All in all, the effects of the pandemic shock on firm borrowing costs have been heterogeneous, with some sectors being more affected than others. We will continue exploring this heterogeneity in exposure and effects in future blog posts.
Notes and References
1 We computed credit spreads by taking information on prices at which bonds are traded from TRACE (FINRA) and combining it with information on bond-level characteristics from Mergent FISD. This follows the methodology used in Gilchrist, Simon; and Zakrajsek, Egon. “Credit Spreads and Business Cycle Fluctuations.” American Economic Review, June 2012, Vol. 102, No. 4, pp. 1692-720. We computed the average spreads by sector in a three-day window around Jan. 2, March 23 and March 31. On average, each sector has 833 transactions, 360 bonds and 71 firms.
2 We defined “high-contact” sectors as having physical proximity indexes greater than or equal to 60 and “low-contact” as the converse. The high-contact industries are Construction, Retail Trade, Transportation, Education, Health Care, Arts and Entertainment, and Accommodation and Food Services.
Additional Resources
Citation
Julian Kozlowski, Miguel Faria-e-Castro and Mahdi Ebsim, ldquoCorporate Bond Spreads and the Pandemic II: Heterogeneity across Sectors ,rdquo St. Louis Fed On the Economy, April 14, 2020.
This blog offers commentary, analysis and data from our economists and experts. Views expressed are not necessarily those of the St. Louis Fed or Federal Reserve System.
Email Us
All other blog-related questions


