How Startups Differ from Mature Small Businesses

Startups make up about one-third of U.S. small employer firms and tend to have bosses who are younger than those running a typical mature small firm, according to the 2016 Small Business Credit Survey: Report on Startup Firms.
The survey, which was a collaboration of all 12 Federal Reserve banks, provides an in-depth look at startups1 and their financing and credit experiences, covering the second half of 2015 through the second half of 2016.
The survey covered small employer firms2 and found the following:
- Twenty percent of small employer firms are startups that are 2 years old or younger.
- Fourteen percent of small employer firms are startups that are 3 to 5 years old.
- The remaining 66 percent of small employer firms are considered mature firms, those that are more than 5 years old.
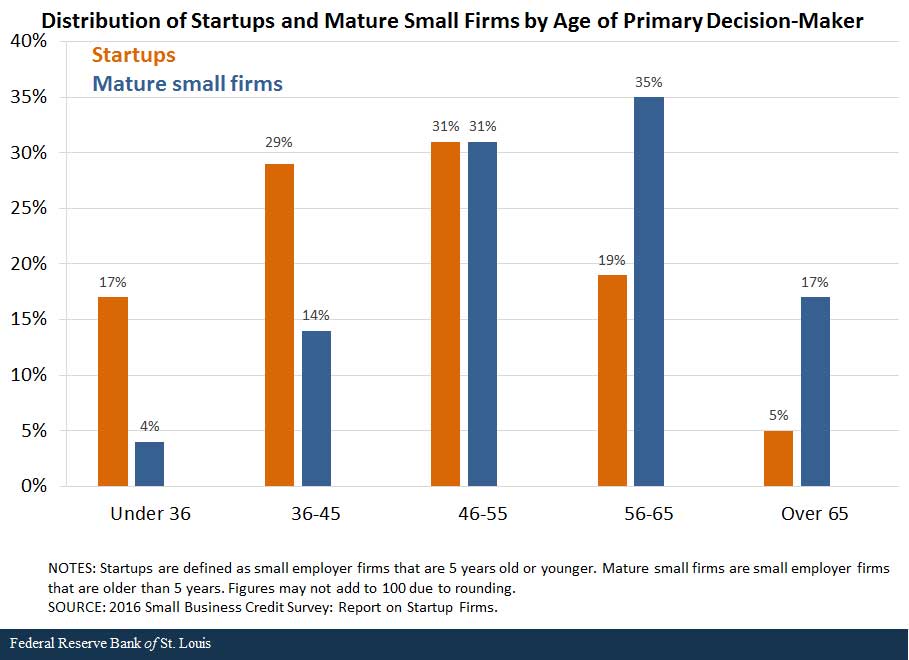
The youth of the startup is also reflected in the age of the firm’s boss: A startup is four times as likely to have a primary decision-maker who is under 36 than a mature small firm (17 percent versus 4 percent), while it is twice as likely (29 percent versus 14 percent) as a mature firm to have a primary decision-maker who is between 36 and 45. (See the figure below.)

Where Are the Startups?
Geographically, startups tend to locate where other older small firms are:
- The South Atlantic region had the biggest share of both of these types of firms: 22 percent of startups and 18 percent of mature small firms are located in this region, which is made up of Delaware, District of Columbia, Florida, Georgia, Maryland, North Carolina, South Carolina, Virginia and West Virginia.
- The New England region had the smallest share of these types of firms: Only 5 percent of both startups and mature small firms are in this region, which is made up of Connecticut, Maine, Massachusetts, New Hampshire, Rhode Island and Vermont.
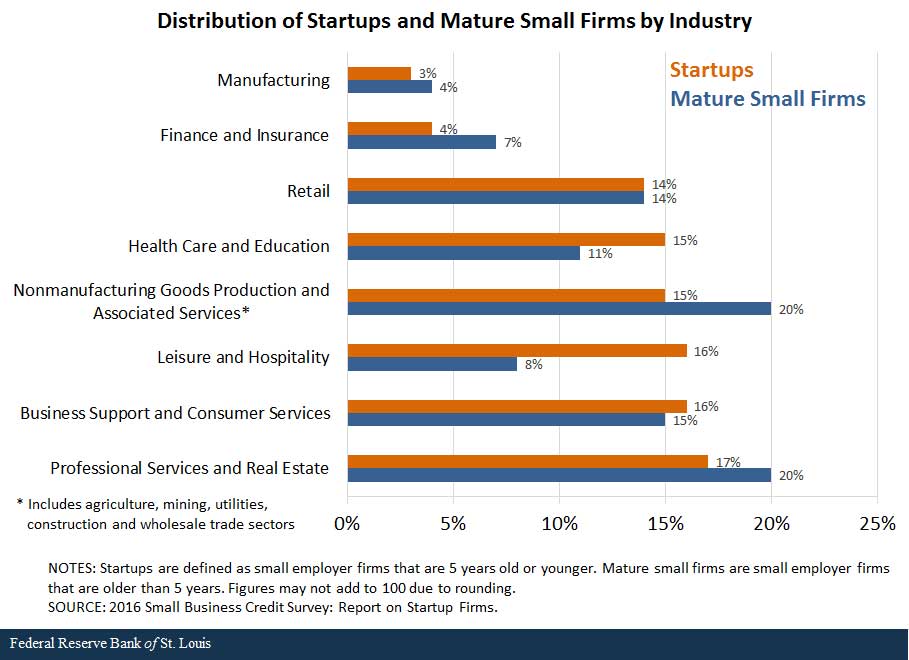
There are some differences in the industries where they work. For instance, startups are twice as likely as mature small firms (16 percent versus 8 percent) to operate in the leisure and hospitality industry. They are also more likely to be in the health care and education industry and the business support and consumer services industry. (See the figure below.)

Notes and References
1 Startup firms are defined as small employer firms that were 5 years old or younger in 2016.
2 Small employer firms are businesses with more than one and fewer than 500 full- or part-time employees.
Additional Resources
- Small Business Credit Survey: Report on Startup Firms
- On the Economy: The Financial Challenges of Startups
- On the Economy: The Financial Challenges of Small Businesses
Citation
ldquoHow Startups Differ from Mature Small Businesses,rdquo St. Louis Fed On the Economy, Oct. 31, 2017.
This blog offers commentary, analysis and data from our economists and experts. Views expressed are not necessarily those of the St. Louis Fed or Federal Reserve System.
Email Us
All other blog-related questions

