The New World Leader in Innovation

Patents are property rights to a knowledge asset, and patent counts are used as a measure (albeit an imperfect one) of the output of innovative activity. The data suggest that the world is becoming more innovative. What countries have contributed the most to this increase in innovation?
Increase in Patent Applications
In the past 15 years, the world has experienced a significant increase in patent applications by residents. Patent applications are worldwide applications that have been filed through the Patent Cooperation Treaty procedure or with a national patent office to obtain the exclusive rights to use an invention (i.e., a new product or a new process). A patent provides protection for the invention to the owner of the patent for a limited period, generally 20 years.
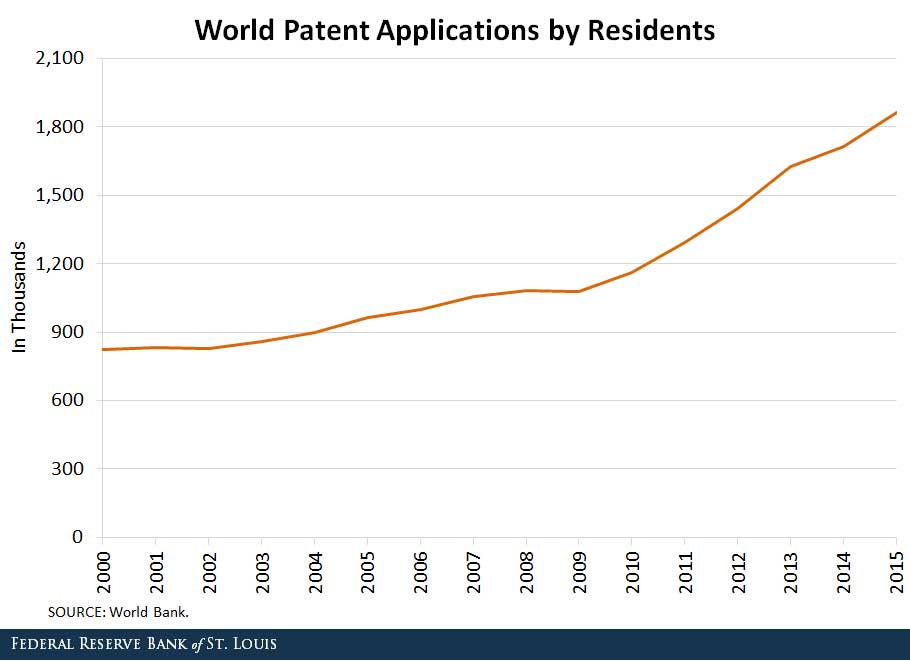
As seen in the figure below, the number of patent applications by residents has risen significantly in the past 15 years:
- In 2000, the number of patent applications was 824,055.1
- In 2015, it raised to 1,862,548.

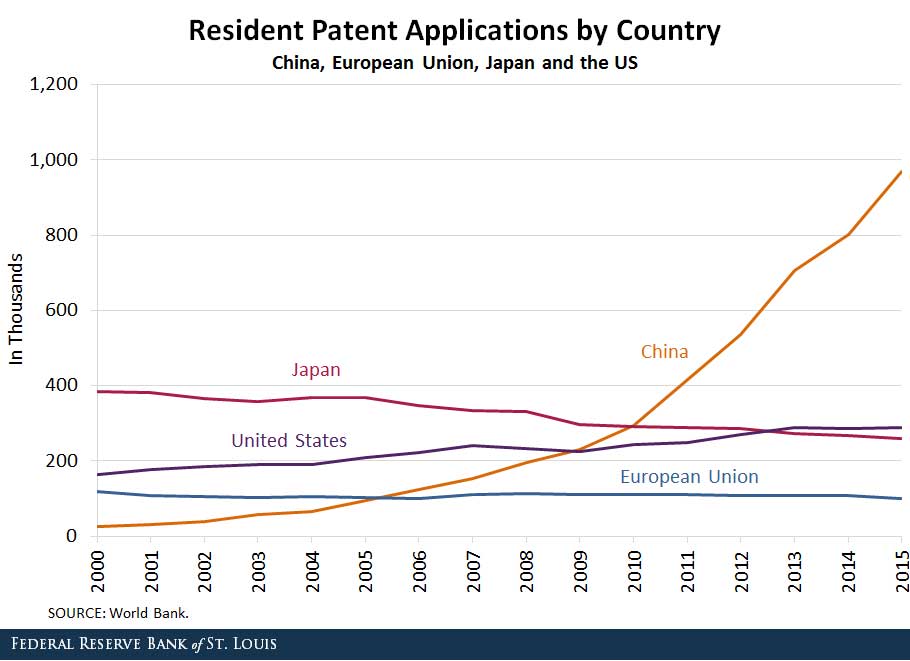
Japan (47 percent), the U.S. (20 percent) and the European Union (14 percent) were the most innovative countries in 2000, accounting for 81 percent of all the patent applications by residents in the world.
However, this distribution changed dramatically by 2015, as seen in the figure below.

China became the most innovative country, accounting for 51 percent of all patent applications by residents in the world in 2015. Japan, the U.S. and the European Union decreased their contribution to 34 percent of all patent applications by residents:
- The U.S. contribution slid to 15 percent in 2015.
- Japan’s share decreased from 47 percent in 2000 to 14 percent in 2015
- The European Union’s share decreased from 14 percent to 5 percent.
What has been behind the increase in patent applications by China, and what are the challenges ahead?
China’s Development Plans
In 2011, China released the 12th Five-Year Plan for National Economic and Social Development. This plan had “innovation target” of 3.3 patents per 10,000 people, marking a significant increase over the 2011 level of 2 patents per 10,000 people.2
By 2011, the share of world patent applications from China was 32 percent. In 2015, the fifth year of the plan, it had increased to 51 percent.
In March 2016, China released the 13th Five-Year Plan for National Economic and Social Development.3 Innovation was once again a cornerstone of the development strategy in China. In the latest plan, the government has as objective to increase the number of patents filed per 10,000 people from 6.3 in 2015 to 12. If the plan is successful again, we should expect to see another increase of patent applications by China.
The challenges ahead for China involve the quality of its patents and the enforcement of intellectual property rights, which are key for the continuation of the innovative activity in the country. These are two areas to focus on when designing policies and establishing targets for future sustainable growth.
Notes and References
1 “World Intellectual Property Indicators 2016.” World Intellectual Property Organization, 2016.
2 See Kasznik, Efrat. “Weighing China’s 1.1 Million Patents.” EE times, Nov. 25, 2016.
3 See Koleski, Katherine. “The 13th Five-Year Plan.” U.S. – China Economic and Security Review Commission, Feb. 14, 2017.
Additional Resources
- On the Economy: Germany and Adjustments in Current Account Imbalances
- On the Economy: Tigers, Tiger Cubs and Economic Growth
- On the Economy: What Is the Impact of Chinese Imports on U.S. Jobs?
Citation
Ana Maria Santacreu, ldquoThe New World Leader in Innovation,rdquo St. Louis Fed On the Economy, July 3, 2017.
This blog offers commentary, analysis and data from our economists and experts. Views expressed are not necessarily those of the St. Louis Fed or Federal Reserve System.
Email Us
All other blog-related questions


