Tigers, Tiger Cubs and Economic Growth

The economic development path of East Asia can be described by dividing the region into groups of countries that have followed similar growth paths. In this post, we highlight the growth of three particular groups of Asian economies since the 1950s.
Japan and the Asian Tigers
To begin, we look at the first newly industrialized economies in the region, which were Japan and the four Asian Tigers:
- Hong Kong
- Singapore
- South Korea
- Taiwan
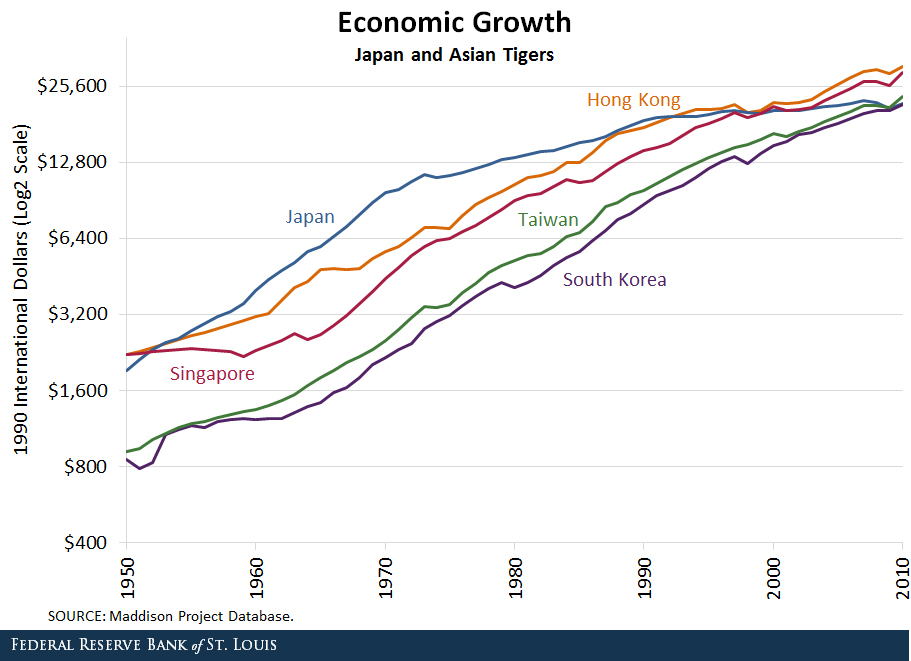
As seen in the figure below, their economic development paths were very similar, although by no means identical.

These economies experienced exceptionally strong growth between the 1950s and 1990s. In 1950, gross domestic product (GDP) per capita ranged from $850 in South Korea to $2,220 in Hong Kong and Singapore.
By 1980, GDP per capita had at least tripled in these countries, and by 2010 it had grown to range between $21,700 in South Korea and $30,720 in Hong Kong. For comparison, output per capita in the U.S. was $9,560 in 1950, $18,580 in 1980, and $30,490 in 2010.1
China and India
China and India, despite being among the largest economies in aggregate terms, have had much lower output per capita, and their rapid growth began later than for the Asian Tigers.
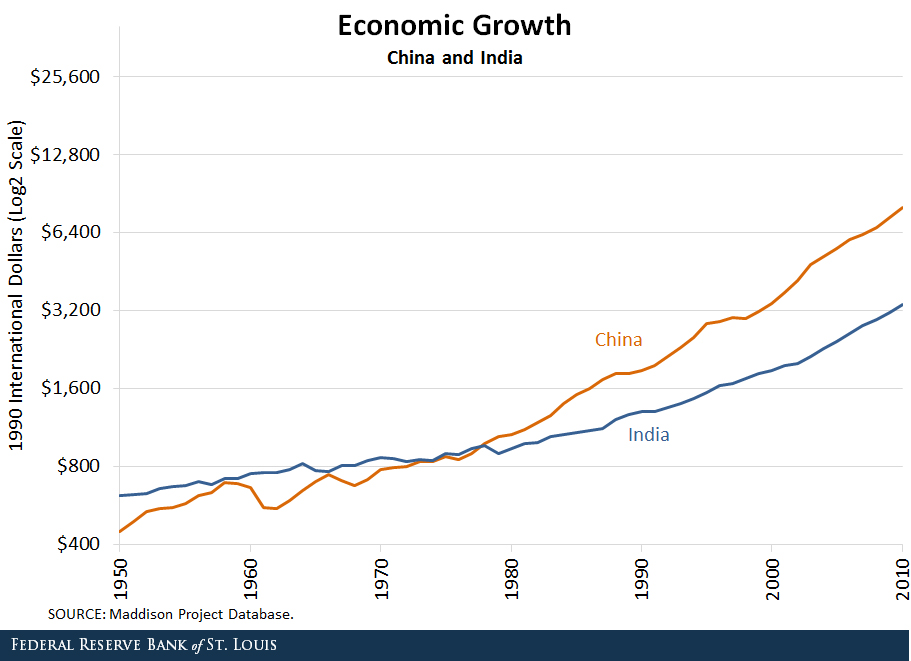
China’s rapid economic development did not begin until at least the late 1970s, while India’s liberalization did not occur until the 1990s, as seen in the figure below.

Between 1980 and 2010, China’s economy grew at an average annual rate of 7 percent, and its GDP per capita went from $1,060 to $8,030. During the same period, India’s economy grew at about 4 percent annually, with its GDP per capita going from $940 to $3,370.
This growth was much faster than in the prior 30 years (between 1950 and 1980), when China and India grew at average annual rates of 3 percent and 1 percent, respectively.
The Asian Tiger Cubs
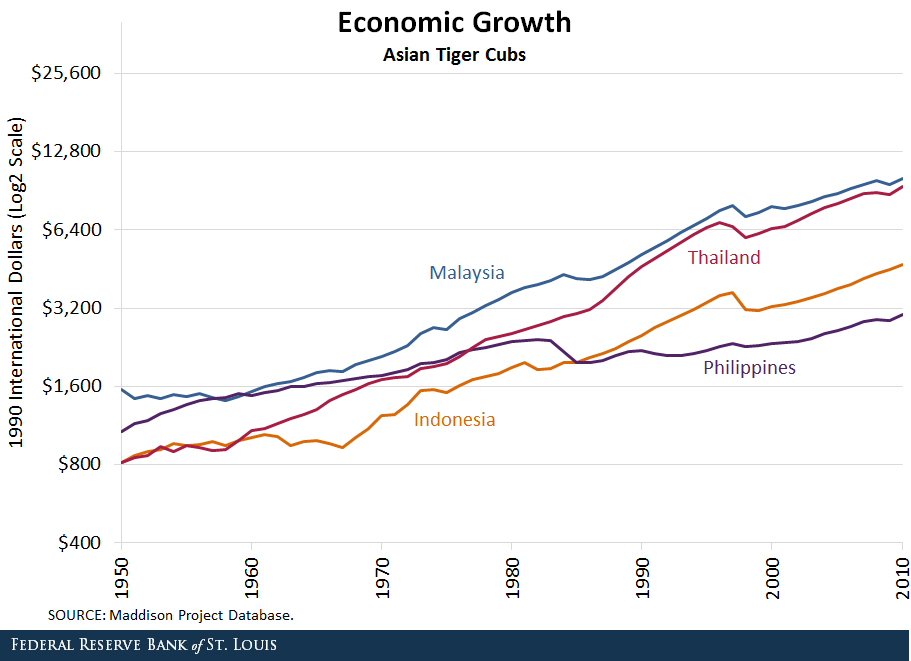
Finally, Malaysia, Thailand, the Philippines and Indonesia—sometimes referred to as “the Tiger Cub Economies”—developed far less rapidly but grew at a much more constant rate during this period, as seen below.

Their income levels were similar to the Asian Tigers in the 1950s, with their GDP per capita ranging from $820 in Indonesia and Thailand to $1,560 in Malaysia. Their growth put them in the same territory as China and India by 2010, with income levels ranging from $3,020 in the Philippines to $10,090 in Malaysia.
As the figures show, the Asian region developed greatly in the last 60 years with most countries going from low-income to middle- and high-income ones and becoming more important players in the world economy.
Notes and References
1 Data are in 1990 constant international dollars, and the figures are plotted on a log2 scale.
Additional Resources
- On the Economy: Why Doesn’t Capital Always Flow to High-Growth Areas?
- On the Economy: What Is the Impact of Chinese Imports on U.S. Jobs?
- On the Economy: China’s Efforts to Boost the Yuan
Citation
Paulina Restrepo-Echavarría and Maria A. Arias, ldquoTigers, Tiger Cubs and Economic Growth,rdquo St. Louis Fed On the Economy, May 25, 2017.
This blog offers commentary, analysis and data from our economists and experts. Views expressed are not necessarily those of the St. Louis Fed or Federal Reserve System.
Email Us
All other blog-related questions


