


Employment Growth in the Eighth District Appears Weaker Than Currently Reported

Employment growth across the Eighth District appears to be weaker than currently reported by the Bureau of Labor Statistics (BLS), according to our latest estimates.
The BLS uses the Current Employment Statistics (CES) to produce monthly estimates of employment. It later revises these figures once a year based on data from the Quarterly Census of Employment and Wages (QCEW).
Rather than wait for the annual revision, we have been producing our own quarterly job figures based on the most recent QCEW available. Earlier this year, we estimated fourth-quarter employment growth for the states and four largest metropolitan statistical areas (MSAs) in the Eighth District.1 With the latest release of the QCEW, we updated our estimates through the first half of 2017.
These estimates use the same administrative data that the BLS will use for its annual benchmark revision in March,2 a process often referred to as “early benchmarking.” Our estimates indicate the following:
- All reported areas have growth slower than the national rate of 1.4 percent over this period.3
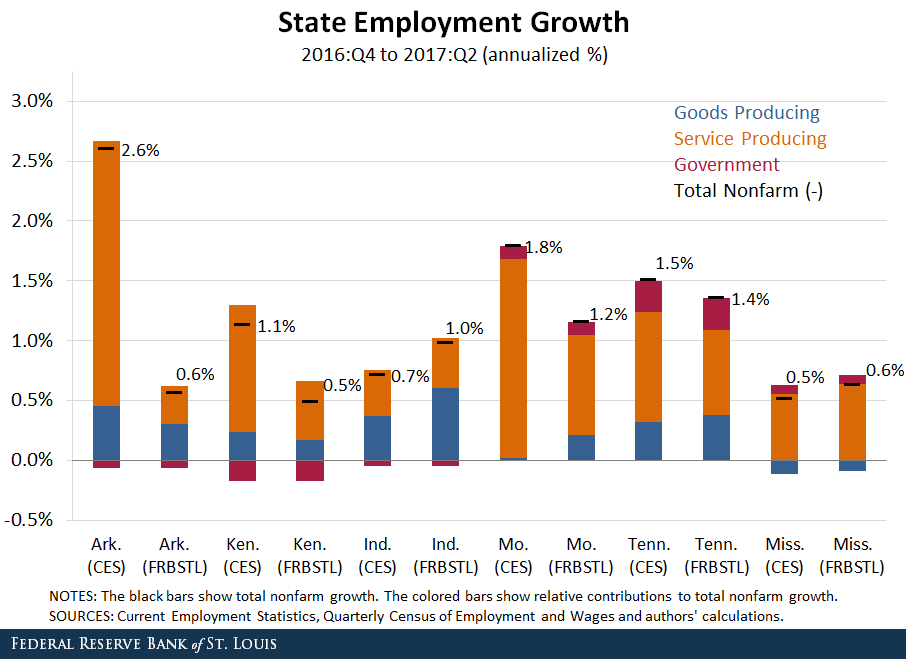
- Growth in Arkansas was significantly weaker than what the current employment data indicates.
- Growth was strongest in Tennessee (1.4 percent), followed by Missouri (1.2 percent).
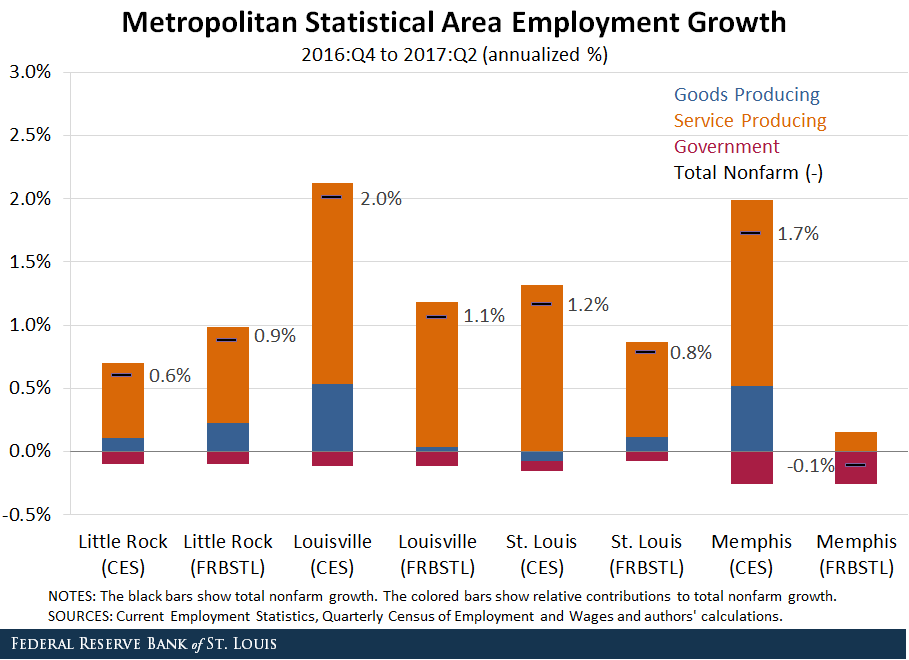
- Among the largest MSAs in the District, growth was strongest in Louisville, Ky., at 1.1 percent, slower than the currently reported rate of 2.0 percent.
- While overall growth was weaker than currently reported, performance improved relative to our previous estimates that covered only the fourth quarter of 2016.
Arkansas
Our estimates report employment growth of 0.6 percent in Arkansas, down from currently reported growth of 2.6 percent. The goods-producing and private service-providing sectors grew at slower rates than currently reported. We estimate weaker growth in every industry but health services, with the largest changes in the leisure and hospitality sector, the trade, transportation and utilities sector, and the professional and business services sector.
In contrast to the statewide data, we estimate slightly stronger growth of 0.9 percent in the Little Rock, Ark., MSA. The goods-producing and private service-providing sectors both grew faster under our estimates than currently reported.
Kentucky and Indiana
Our estimates show that growth in Kentucky was weaker than currently reported, down to 0.5 percent from 1.1 percent. Weaker growth in the private service-providing sector pulled overall growth down, largely because of a shift from significant growth to a contraction in professional and business services.
We estimate stronger growth in Indiana, up to 1 percent. Stronger growth in manufacturing pushed up the goods-producing sector and overall growth. While we estimate much stronger growth in the trade, transportation and utilities sector, weaker growth in the financial services sector, the professional and business services sector, and other services offset those gains.
Growth in the Louisville MSA was weaker than currently reported, bringing its growth rate down to 1.1 percent. We expect that the BLS will revise away much of the currently reported growth in the goods-producing sector.
Missouri
We estimate growth in Missouri of 1.2 percent, down from a currently reported 1.8 percent. Growth was stronger in the goods-producing sector, particularly the mining, logging and construction sector.
However, weaker performance in the leisure and hospitality sector, the professional and business services sector, and the trade, transportation and utilities sector outweighed the gains made in the goods-producing sector.
Our estimates for the St. Louis MSA brought employment growth down to 0.8 percent from a currently reported 1.2 percent because of weaker growth in the service-providing sector.
Tennessee and Mississippi
Our estimates report overall growth in Tennessee of 1.4 percent, similar to what the BLS currently reports. Growth in the service-providing sector was slightly lower than currently reported because of weaker performance in professional and business services and trade, transportation and utilities.
We estimate growth in Mississippi of 0.6 percent, up from a currently reported 0.5 percent. Growth was similar in both the goods-producing and service-providing sectors.
We estimate growth in the Memphis, Tenn., MSA of -0.1 percent, down from a currently reported 1.7 percent. Performance was weaker in both the goods-producing and service-providing sectors.
How Can We Predict These Revisions?
Around the 20th of each month, the BLS releases estimates of state and local employment for the previous month produced from its CES survey. This is a voluntary survey of businesses and samples about 7 percent of establishments. The BLS revises the previous 15 months of CES data each March using less timely (but required business filing for all establishments with employees) data from the QCEW.
Because the BLS releases QCEW data with a six-month lag but only benchmarks every March, we have been able to produce early estimates of revised state and local employment after each release of the QCEW.
Notes and References
1 The Eighth District includes all of Arkansas and parts of Illinois, Indiana, Kentucky, Mississippi, Missouri and Tennessee. We excluded Illinois from our analysis since most of its economic activity stems from the Chicago area, which is outside the District.
2 We produced estimates for total nonfarm employment and each of the major industries (excluding government), following methods outlined by the Dallas Fed on its webpage discussing early benchmarking.
3 The growth rate in Tennessee is 1.37 percent, while the national rate is 1.43 percent. Both are reported as 1.4 percent after rounding.
Additional Resources
- On the Economy: How Is Employment Really Faring in the Eighth District?
- On the Economy: How Quickly Do People Apply for Jobs?
- On the Economy: How Precise Are Local Unemployment Rates?


Citation
Charles S. Gascon and Paul Morris, ldquoEmployment Growth in the Eighth District Appears Weaker Than Currently Reported,rdquo St. Louis Fed On the Economy, Dec. 21, 2017.
This blog offers commentary, analysis and data from our economists and experts. Views expressed are not necessarily those of the St. Louis Fed or Federal Reserve System.
Email Us
All other blog-related questions