


How Precise Are Local Unemployment Rates?

Many gauge the health of local labor markets based on the difference between the local and national unemployment rates. What is often overlooked is that these rates, statistically speaking, often could be the same.
Estimating the Unemployment Rate
The Bureau of Labor Statistics (BLS) relies on sampling and advanced statistical techniques when estimating the unemployment rate. Thus, its value is subject to both sampling and nonsampling error. The BLS accounts for sampling error by reporting intervals that indicate the range the true unemployment rate is likely to be in for the nation and each of the states.
Unemployment Rate Ranges
The national unemployment rate was estimated to be 4.3 percent in July and 4.4 percent in August. It is estimated that a slightly larger share of the labor force was unable to find employment, but we cannot say that the unemployment rate changed significantly in August.
The BLS reports that the increase would have had to be 0.17 percentage points to be significant at a 90 percent confidence level.1 The BLS uses a large sample to estimate the national unemployment rate, so the sampling error is thus relatively small.
State Rates and Sampling Errors
However, the BLS relies on much smaller samples to estimate unemployment rates at the state level, meaning we are stuck with larger sampling errors and confidence intervals. The table below reports the August unemployment rates and corresponding 90 percent confidence intervals for the states in the Eighth Federal Reserve District.2
| State | August Unemployment Rate | 90% Confidence Interval | Higher/Lower than National Rate at 90% Confidence | Over-the-Month Rate Change | |
|---|---|---|---|---|---|
| Difference | Significant at 90% Confidence | ||||
| Arkansas | 3.5 | 2.9 - 4.0 | L | 0.1 | NO |
| Illinois | 5.0 | 4.4 - 5.6 | * | 0.2 | YES |
| Indiana | 3.5 | 2.9 - 4.1 | L | 0.4 | YES |
| Kentucky | 5.4 | 4.7 - 6.2 | H | 0.0 | NO |
| Mississippi | 5.3 | 4.6 - 6.1 | H | 0.1 | NO |
| Missouri | 4.0 | 3.2 - 4.7 | * | 0.2 | NO |
| Tennessee | 3.3 | 2.6 - 3.9 | L | -0.1 | NO |
| * The unemployment rate confidence intervals for Illinois and Missouri contain 4.4 percent, or the national unemployment rate for August. | |||||
| SOURCE: Bureau of Labor Statistics | |||||
| Federal Reserve Bank of St. Louis | |||||
The intervals let us easily check if a state’s unemployment rate is statistically different from the national rate by seeing if the interval is lower than, is higher than or contains the national unemployment rate.
For August, the unemployment rate was statistically lower than the national rate of 4.4 percent in:
- Arkansas (2.9 to 4.0 percent)
- Indiana (2.9 to 4.1 percent)
- Tennessee (2.6 to 3.9 percent)
It was statistically higher in:
- Kentucky (4.7 to 6.2 percent)
- Mississippi (4.6 to 6.1 percent)
However, we cannot say that the Illinois (4.4 to 5.6) and Missouri (3.2 to 4.7) rates are statistically different from the national rate because the 90 percent confidence intervals for those states contain 4.4 percent.
In addition, the over-the-month rate changes for August range from -0.1 to 0.4 percentage points, with significant increases from the previous month in Illinois and Indiana.
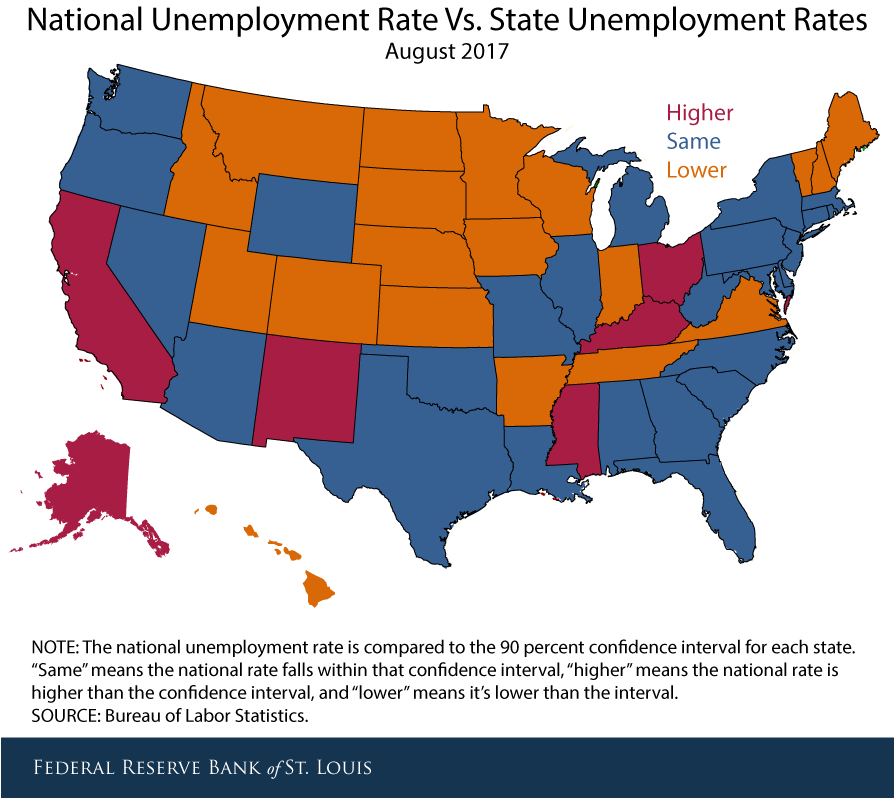
The figure below shows how the national unemployment rate in August stacked up against confidence intervals for all 50 state unemployment rates.
Confidence in the Unemployment Rate
When looking at unemployment rate levels and changes at the state and regional levels, it is important to keep in mind that these estimates rely on small samples and inherently have a high degree of uncertainty attached to them. The true unemployment rate is thus unknown.
This is especially true at the local level. While the BLS does not release confidence intervals for metropolitan statistical area unemployment rates, they are likely larger than those reported for the states. This means changes would have to be even greater to be considered statistically and economically significant.
Because the data are uncertain, supplementing the data with anecdotal reports such as the Beige Book and alternative data sources such as initial unemployment insurance claims can help in gaining a complete understanding of state and regional labor markets.
Notes and References
1 See the BLS’ statistical summary table for the national unemployment rate at https://www.bls.gov/web/empsit/cpssigsuma.pdf.
2 The complete table is available from the BLS at https://www.bls.gov/lau/lastderr.htm.
Additional Resources
- Beige Book
- On the Economy: Changing Labor Market Leads to Job Polarization
- On the Economy: How Income Inequality Is Affected by Labor Share


Citation
Charles S. Gascon and Paul Morris, ldquoHow Precise Are Local Unemployment Rates?,rdquo St. Louis Fed On the Economy, Sept. 28, 2017.
This blog offers commentary, analysis and data from our economists and experts. Views expressed are not necessarily those of the St. Louis Fed or Federal Reserve System.
Email Us
All other blog-related questions