


Is the U.S. in a Recession? What Key Economic Indicators Say
A common rule of thumb for identifying recessions is experiencing two consecutive quarters of negative gross domestic product (GDP) growth. The release of U.S. GDP data for the second quarter of 2022 showed the second consecutive negative GDP growth rate, leading many to believe that the country is now in a recession.
However, the National Bureau of Economic Research (NBER) Business Cycle Dating Committee (BCDC)—the committee responsible for identifying the dates of peaks and troughs that frame economic recessions and expansions—defines recessions differently: “A recession involves a significant decline in economic activity that is spread across the economy and lasts more than a few months.” In the committee’s view, three criteria—depth, diffusion and duration—each must be met to some degree to declare a recession.Extreme conditions for one criterion may partially offset weaker indications from another. Thus, emphasis is placed on a variety of measures of economic activity rather than on a single measure, such as GDP growth.
More specifically, the NBER considers these additional economic indicators:According to the BCDC, although there are no fixed rules regarding how the measurements are weighted in their decisions, real personal income less transfers and nonfarm payroll employment have been weighted most heavily in recent decades.
- Real personal income less transfer payments
- Nonfarm payroll employment
- Employment as measured by the household survey
- Real personal consumption expenditures
- Wholesale-retail sales adjusted for price changes (real manufacturing and trade sales)
- Industrial production
So far this year, the NBER has not declared that the U.S. economy is in a recession.
The Behavior of Key Indicators around Recession Starts
Why not look at just one (admittedly, very important) indicator? First, a single indicator can provide misleading evidence about the state of the economy, especially if one’s focus is on a pervasive economic downturn. Second, some indicators are revised. For example, in 2000, estimates of GDP growth suggested two consecutive negative quarters (in real time). However, when the data were later revised, GDP growth was only (barely) negative for one quarter.
Historically, how do these indicators behave around the beginning of recessions? The table below shows the percentage change of these indicators, on average, across recessions since 1947 for (1) the period prior to the recession, defined as the quarter prior to the peak and quarter marking the peak; (2) the first two quarters subsequent to the peak; and (3) the entirety of the recession (the quarter after the peak through the quarter of the trough, inclusive).Though the BCDC hasn’t declared that the economy is currently in a recession, our calculations include the current periods: the third quarter of 2021 through the second quarter of 2022.
| Indicator | Prior to Recession | Two Subsequent Quarters | Entire Recession | Most Recent Quarter (2022:Q2) |
|---|---|---|---|---|
| Real personal income | 0.62% | -0.83% | -1.52% | 0.24% |
| Nonfarm payroll | 0.30% | -1.32% | -2.51% | 0.84% |
| Household employment | 0.30% | -1.42% | -1.87% | 0.27% |
| Real personal consumption | 0.48% | -2.92% | -3.72% | 0.26% |
| Wholesale-retail sales | 0.28% | -0.95% | -3.54% | -0.09% |
| Industrial production | 0.05% | -2.79% | -5.88% | 1.49% |
| SOURCES: FRED (Federal Reserve Economic Data) and authors’ calculations. | ||||
| NOTES: Data on real personal consumption only go as far back as 2002. Therefore, the fact that the indicator faces the sharpest decline may be, in some part, due to a limited number of observations. Additionally, data are available for the second quarter of 2022 for all indicators except wholesale-retail sales, for which the most recent data only go as far as the first quarter of 2022. | ||||
In the two quarters leading up to the average recession, all measures were still experiencing varying degrees of positive growth. Real personal income grew at an average of 0.62% prior to the average recession, while industrial production grew slightly, by 0.05%. Meanwhile, immediately following the onset of the average recession, all six indicators declined, which ultimately persisted for the entirety of the recession. Interestingly, the last column in the table shows the most recent quarter (2020:Q2) of each indicator. All except wholesale-retail sales (which was barely negative) were still experiencing positive growth following the first quarter of 2022.
The Movement of Key Indicators during Recessions
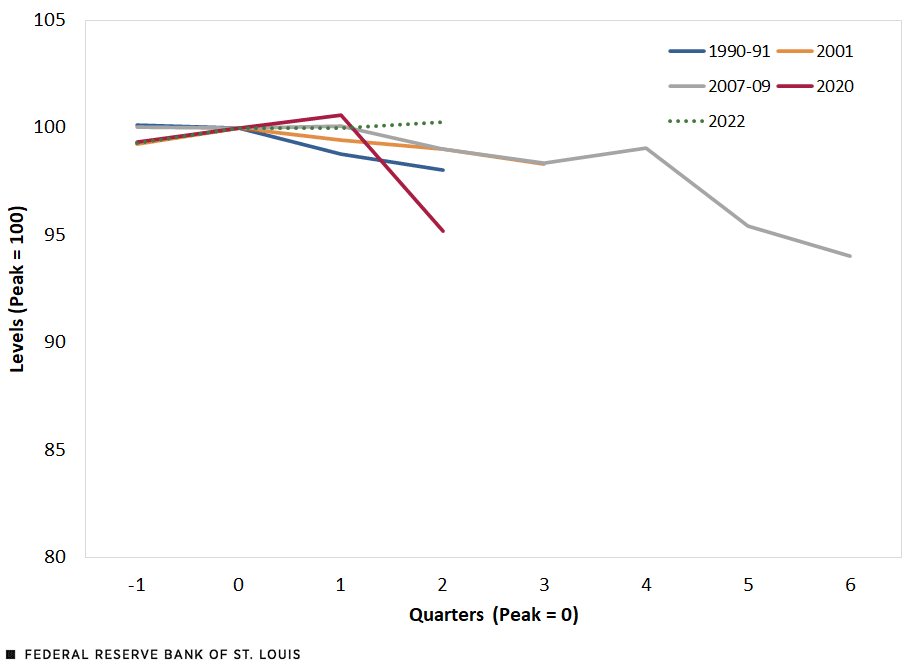
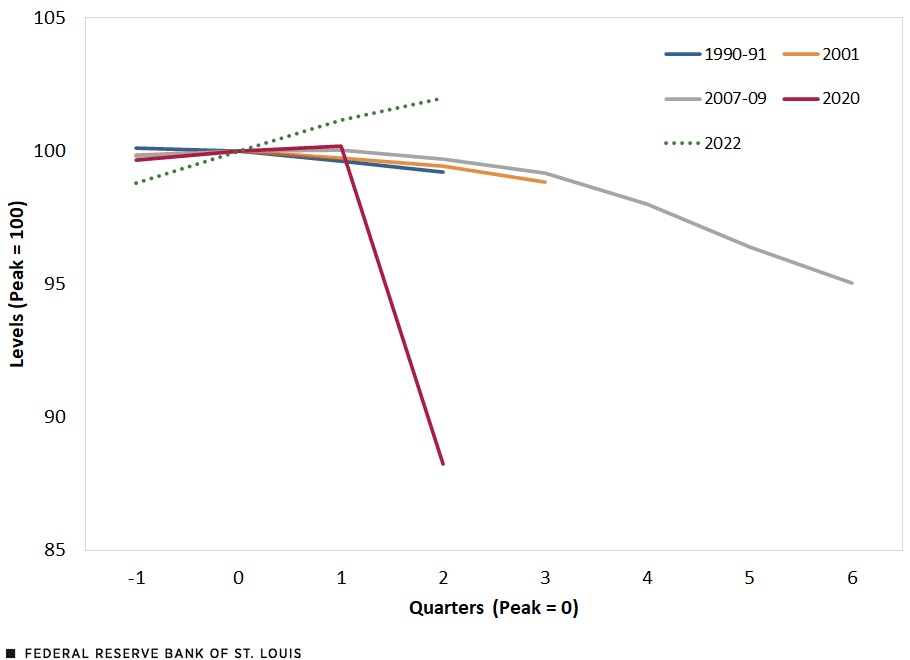
The four figures below plot the normalized (peak=100) levels for real personal income, nonfarm payroll employment, wholesale-retail sales and industrial production, respectively, focusing on recessions occurring during the most recent decades and the indicators’ movements this year.We focused on these four indicators because data for real personal consumption are limited, and nonfarm payroll employment and household employment measure essentially the same thing.
Real Personal Income Less Transfers
U.S. Nonfarm Payroll Employment
Wholesale-Retail Sales Adjusted for Price Changes
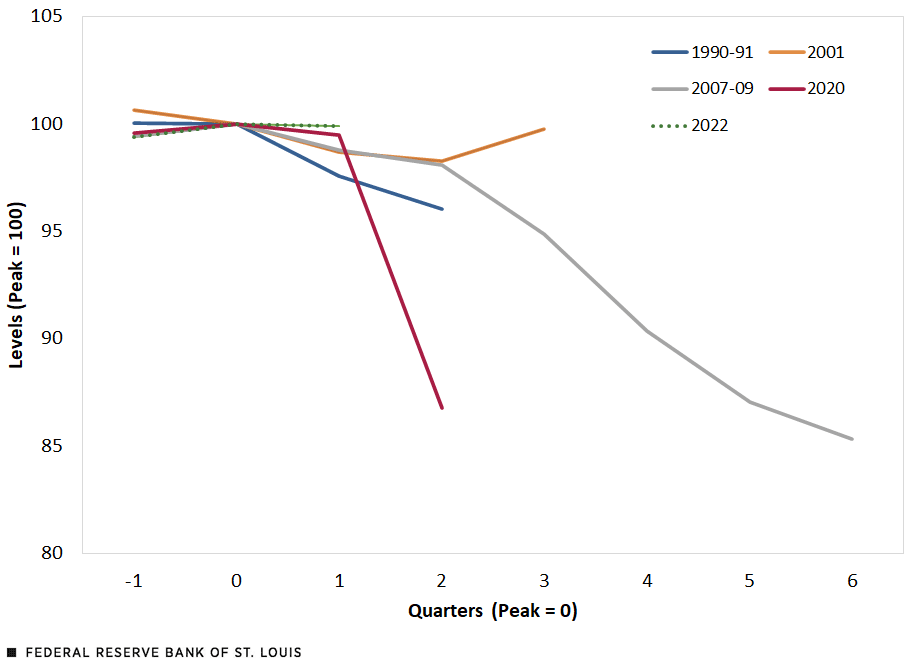
Industrial Production

SOURCES FOR FOUR FIGURES: FRED (Federal Reserve Economic Data) and authors’ calculations.
NOTE FOR THE FOUR FIGURES: The figures plot the indicators’ movements during the 1990-91, 2001, 2007-09 and 2020 recessions; the dotted green line shows their most recent movements if a peak had occurred in the fourth quarter of 2021. Data are seasonally adjusted.
For the most recent recessions, wholesale-retail sales and industrial production fell, while real personal income and nonfarm payroll employment increased only slightly. However, eventually even these two indicators saw negative growth. For example, the normalized level of real personal income fell by 4.8% in the second quarter of 2020.According to the BCDC, the 2020 recession spanned two quarters: the first quarter of 2020 and the second quarter of 2020. At the same time, the level of nonfarm payroll employment saw an 11.7% decline in workers.Total nonfarm payroll accounts for approximately 80% of workers contributing to GDP.
However, focusing on the current period, we show that 2022 is not following this trend. In fact, three of the four indicators (excluding wholesale-retail sales) have increased since the third quarter of 2021—which would have been the prior quarter to a peak in the fourth quarter of 2021 if using the rule of thumb.
Given the fact that the majority of the indicators are still experiencing growth rather than decline, there may not yet be a strong argument supporting the assertion that there currently exists a significant and widespread decline in economic activity. While the job of identifying the dates of peaks and troughs belongs to the NBER BCDC, it does face a number of challenges in doing so,A recent St. Louis Fed On the Economy blog post by Kevin Kliesen refers to these challenges as being related to the backward-looking nature of key economic data and data revisions. and historically the committee tends to announce its decisions after the fact. However, we can know for certain that careful consideration will be given to several broad measures of economic activity outside of GDP growth.
Notes
- Extreme conditions for one criterion may partially offset weaker indications from another.
- According to the BCDC, although there are no fixed rules regarding how the measurements are weighted in their decisions, real personal income less transfers and nonfarm payroll employment have been weighted most heavily in recent decades.
- Though the BCDC hasn’t declared that the economy is currently in a recession, our calculations include the current periods: the third quarter of 2021 through the second quarter of 2022.
- We focused on these four indicators because data for real personal consumption are limited, and nonfarm payroll employment and household employment measure essentially the same thing.
- According to the BCDC, the 2020 recession spanned two quarters: the first quarter of 2020 and the second quarter of 2020.
- Total nonfarm payroll accounts for approximately 80% of workers contributing to GDP.
- A recent St. Louis Fed On the Economy blog post by Kevin Kliesen refers to these challenges as being related to the backward-looking nature of key economic data and data revisions.


Citation
Michael T. Owyang and Ashley H. Stewart, ldquoIs the U.S. in a Recession? What Key Economic Indicators Say,rdquo St. Louis Fed On the Economy, Sept. 26, 2022.
This blog offers commentary, analysis and data from our economists and experts. Views expressed are not necessarily those of the St. Louis Fed or Federal Reserve System.
Email Us
All other blog-related questions