Disconnected Young Adults: A Look at the Eighth Federal Reserve District
While in the fall many young adults return to school, accept internships or pursue training in the trades, not all young adults have access to such opportunities. Without proper support, barriers such as lack of transportation, access to child care and gaps in employment history can place them at a disadvantage, leading to missed opportunities for professional development. Many factors—geography, race, sex, educational attainment, income, disability status and seasonality—can deeply affect the rates at which U.S. young adults are “disconnected,” meaning they are neither in school nor working. Analyzing the young adult population by these factors can help identify which groups are most at risk of disconnection so that communities can use this knowledge for creating or expanding initiatives to improve the way young adults engage with the economy and for reducing economic disparities.
Through the information presented in this report, we hope to shed light on the volume of young adults experiencing disconnection, understand various characteristics of this population in the Eighth Federal Reserve District,The Eighth District includes all of Arkansas, southern Illinois, southern Indiana, western Kentucky, northern Mississippi, eastern Missouri and western Tennessee. and explore how barriers to education and work, which were exacerbated by the COVID-19 pandemic, continue to impact young adults today.
Report Findings for Eighth District States Visualized
View facts sheets with state and metro-level data on the labor market experiences of young adults who are not working or enrolled in school:

Excluding the summer months, 13.3% of U.S. young adults (defined as those ages 18 to 24) were disconnected in 2022, down from a high of 13.8% in 2020.See the April 6, 2023, Dallas Fed article, “Young Adults Are Disconnected from Work and School Due to Long-term Labor Force Trends.” These percentages exclude June-August data to avoid mistaking students as disconnected in the summer. However, in 2022, 35% of young adults reported having no income from wages or a salary—up from 22% in 1990.This calculation is based on CPS data in the March Annual Social and Economic Supplement rather than aggregated monthly CPS microdata. When young adults who are enrolled in school are excluded, these estimates fall but still show an upward trend. (As an aside, when this zero-wage population is included in the calculation, young adults’ real incomes were stagnant between 2019—the last peak in the business cycle—and 2022, a striking finding given the labor market in 2022 was the strongest on record.) Not controlling for seasonality, the number of young adults who are not enrolled in school and the large share of those not earning wages put the rate of disconnection in the U.S. at close to 1 in 4.This calculation includes the summer months of June through August and uses monthly CPS microdata aggregated from January 2017 to June 2024.
Disconnected young adults sometimes are referred to as “at-risk youth” because they face obstacles to their long-term development and as “opportunity youth” (PDF) because of their unrealized potential to earn and learn. Another term often used to refer to this group is “NEET,” which stands for “not in employment, education or training.” However, young adults meeting this description may be more challenging to track if information on training programs is not publicly available. For consistency, we will refer to this population of young adults as “disconnected” throughout the remainder of our report.
How are the high levels of disconnection nationwide reflected among young adults in the Eighth District? This question is important because examining the way certain sociodemographic characteristics of the region’s young adults translate into varying disconnection rates could reveal deep structural barriers to economic participation.
A simple definition is important to consider: Economic growth is the sum of productivity growth and population growth. It has direct relevance here, even at the regional and metro levels. By not adequately investing in disconnected young adults and ways to lessen large and persistent earnings and employment disparities, overall economic growth could be less than its potential due to lower productivity, requiring community resources to create and expand “second chance” efforts designed to encourage greater productivity growth instead.
From a business perspective, our estimates indicate that buying power is diminished—meaning potential revenue is left on the table—when racial, ethnic and geographic income disparities persist,See the March 7, 2023, On the Economy post, “Understanding the Cases for Economic Equity.” especially among young adults in urban and rural areas who are just starting their careers and may have many working years ahead of them. While it is not uncommon for young adults to experience brief periods of disconnection, those episodes can shape their long-term economic outcomes. During such periods, they are not acquiring the necessary education, skills, work experience and networks to compete in the economy.
Explanations for disconnection include a lack of affordable and available child care, a lack of English proficiency, incarceration and reentry, economic downturns and residency in rural areas. For instance, disconnected young adult women were four times as likely to have a child as nondisconnected young adult women, and disconnected young adults were three times as likely to have a disability as nondisconnected young adults.See Ashley Palmer and John Connolly’s November 2022 article in Child and Adolescent Social Work Journal, “Beyond ‘Disconnected Youth’: Characterizing Developmental Heterogeneity in School or Work Connections during Emerging Adulthood,” and Kristen Lewis’ April 2019 Social Science Research Council report, Making the Connection: Transportation and Youth Disconnection (PDF). In another example, roughly 1 in 5 young adults living in rural areas were disconnected, compared with 1 in 6 urban young adults.See our Aug. 15, 2024, On the Economy post, “Not Working, Out-of-School Young Adults in the U.S. by Race and Geography.”
There is no single explanation for why one young adult population may be more disconnected than another. Rather, a series of related and compounding issues can lead to gaps in employment or inconsistent employment and missed opportunities for professional development, thus making it challenging to reenter the labor force. For instance, a possible explanation for the higher rates of disconnected young adults in rural areas could be that rural communities often face several factors that raise the risk of disconnection concurrently. Compared with urban communities, rural communities have higher instances of household mental illness, substance abuse, economic hardship and incarceration.See Elizabeth Crouch, Elizabeth Radcliff, Janice C. Probst, Kevin J. Bennett and Selina Hunt McKinney’s April 2, 2019, article, “Rural-Urban Differences in Adverse Childhood Experiences across a National Sample of Children,” in The Journal of Rural Health. Multiple issues, especially when coupled with fewer resources, can make it challenging to reach and support disconnected young adults without systemic changes.
This report expands recent analysis by Community Development researchers at the St. Louis Fed on disconnection rates among U.S. young adults living in rural areas, metro areas and the principal cities of those metro areas.Again, see our Aug. 15, 2024, On the Economy post examining disconnected young adults by race and geography. We revisit some of the national data in this report, but we focus the thrust of our investigation on the Eighth District and young adults’ labor market experiences.
The report is organized as follows: First, we use data from the Current Population Survey (CPS)The CPS queries U.S. households and is conducted jointly by the Census Bureau and the U.S. Bureau of Labor Statistics. to describe young adult disconnection rates nationally and in the Eighth District. Specifically, we pooled monthly CPS microdata from January 2017 to June 2024—which covers economic conditions before the COVID-19 pandemic and more recently—to create a sample size adequate for disaggregation, or dividing.This report extends the period that our dataset covers through June 2024, which is why some estimates may vary slightly from those in past analysis.
Second, we assess how young adults’ disconnection rates differ when considering geography, education, race/ethnicity, sex, family income, disability status and seasonality. For instance, national or state-level data are often disaggregated to examine just cities or rural areas. We define “rural” as nonmetropolitan areas and “cities” as the principal city within metro areas as reported in the CPS.
Third, past research has shown that young adults are more sensitive to changes in macroeconomic conditions. Thus, estimating the impact that job opening levels have on young adult employment outcomes is a key contribution of this analysis.
Fourth, we examine how unemployment rates for young adults who are not in school moved systematically lower than unemployment rates for other adults between January 2017 and June 2024.
Finally, we discuss the most recent data on labor force participation nationally and in the Eighth District.
National and Eighth District Young Adult Disconnection Rates
We estimated the disconnection rate for U.S. young adults—again, the share of 18- to 24-year-olds not employed and not enrolled in high school or college—using data for 260 metropolitan statistical areas (MSAs) and micropolitan statistical areas (together, “metro areas”) identified in the CPS and located across all 50 states and Washington, D.C. In addition to these metro areas, we examined young adult disconnection rates in two other geographies:
- Rural areas are those outside of MSAs and micropolitan statistical areas.
- Principal cities are the largest city in the metro areas in our sample.
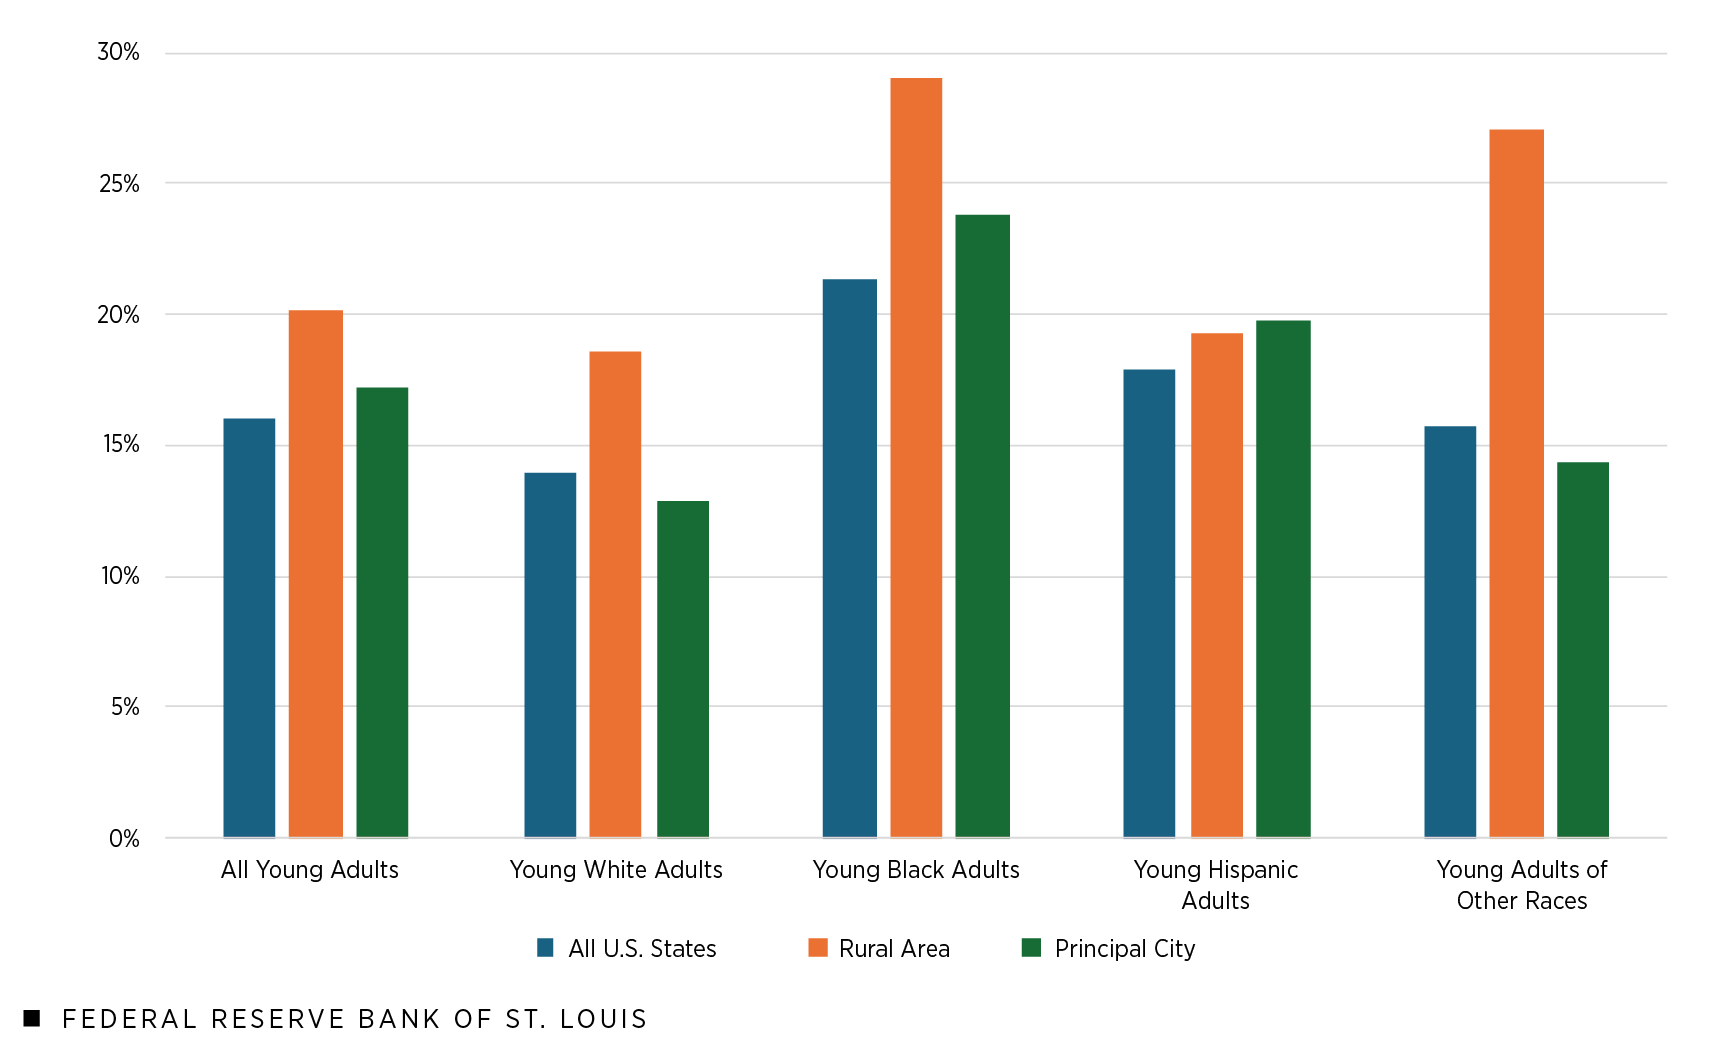
Figure 1 and Figure 2 report rates of disconnection among young adults across the U.S. and within the Eighth District, respectively. Data are disaggregated by race/ethnicity and geography for all states, rural areas and principal cities. Note that the figures do not display metro areas because their disconnection rates and patterns are similar to those at state levels.
The national disconnection rate for all young adults over our period of observation was 16% (Figure 1). Rates varied across rural areas and cities. The rate in rural areas was the highest for almost all races/ethnicities, with an average of 20.2%. The average rate in principal cities sat at 17.2%. When disaggregating the data by race/ethnicity and geography, young Black adults living in rural areas had the highest disconnection rate, at 29%. They were followed by young adults in an “other” racial group—which comprised American Indians, Alaska Natives, Asians, Hawaiian/Pacific Islanders and those identifying as unlisted races or multiple races—living in rural areas, who had a disconnection rate of 27.1%. Young Hispanic adults in rural areas had a disconnection rate of 19.3%, with young white adults in rural areas trailing closely at 18.6%.The white, Black and “other” racial groups are those CPS respondents identifying as non-Hispanic. The Hispanic group comprises respondents identifying as Hispanic or Latino regardless of race. These data suggest that disconnection rates are consistently higher, regardless of race/ethnicity, in rural areas across the U.S.
Figure 1: Rates of Disconnection among U.S. Young Adults
SOURCES: Current Population Survey microdata from January 2017 to June 2024 and authors’ calculations.
NOTES: Respondents were ages 18 to 24. Disconnected young adults were not enrolled in high school or college, and they were not employed. This includes unemployed on layoff, unemployed but looking for work, and not in the labor force due to retirement, disability or other reasons. All estimates were weighted using CPS person weights. Rural designates those living outside metro areas; principal city designates those living in the largest city within each of 260 metro areas identified in the CPS.
Figure 2 reports disconnection rates for young adults living in Eighth District states, which are Arkansas, Illinois, Indiana, Kentucky, Mississippi, Missouri and Tennessee. Similar to the national estimate, rural areas in the Eighth District had the highest rate of disconnected young adults, with an average of 20.1%. The average rate for young adults from a principal city in Eighth District metro areas was slightly lower at 18%. However, some different patterns emerge when disaggregating the data by race/ethnicity and geography. The highest disconnection rate in the Eighth District was for young Black adults living in principal cities (28.6%), whereas the rate for young Black adults in rural areas was a bit lower at 24.2%. Similarly, young Hispanic adults from cities had a higher disconnection rate (19.6%) than those from rural areas (15%). In contrast, young white adults living in rural areas had a higher disconnection rate (20.1%) than those in cities (12.8%). Together, what these data might suggest is that resources or opportunities are disproportionately available for young white adults in cities compared with what young Black adults or young Hispanic adults may be able to access.
Figure 2: Rates of Disconnection among Eighth District Young Adults
SOURCES: Current Population Survey microdata from January 2017 to June 2024 and authors’ calculations.
NOTES: Respondents were ages 18 to 24. Disconnected young adults were not enrolled in high school or college, and they were not employed. This includes unemployed on layoff, unemployed but looking for work, and not in the labor force due to retirement, disability or other reasons. All estimates were weighted using CPS person weights. The Eighth District states are Arkansas, Illinois, Indiana, Kentucky, Mississippi, Missouri and Tennessee. Rural designates those living outside metro areas. Principal cities in Eighth District metro areas for which data are available are Evansville, Ind.; Fayetteville, Ark.; Little Rock, Ark.; Louisville, Ky.; Memphis, Tenn.; Springfield, Mo.; and St. Louis.
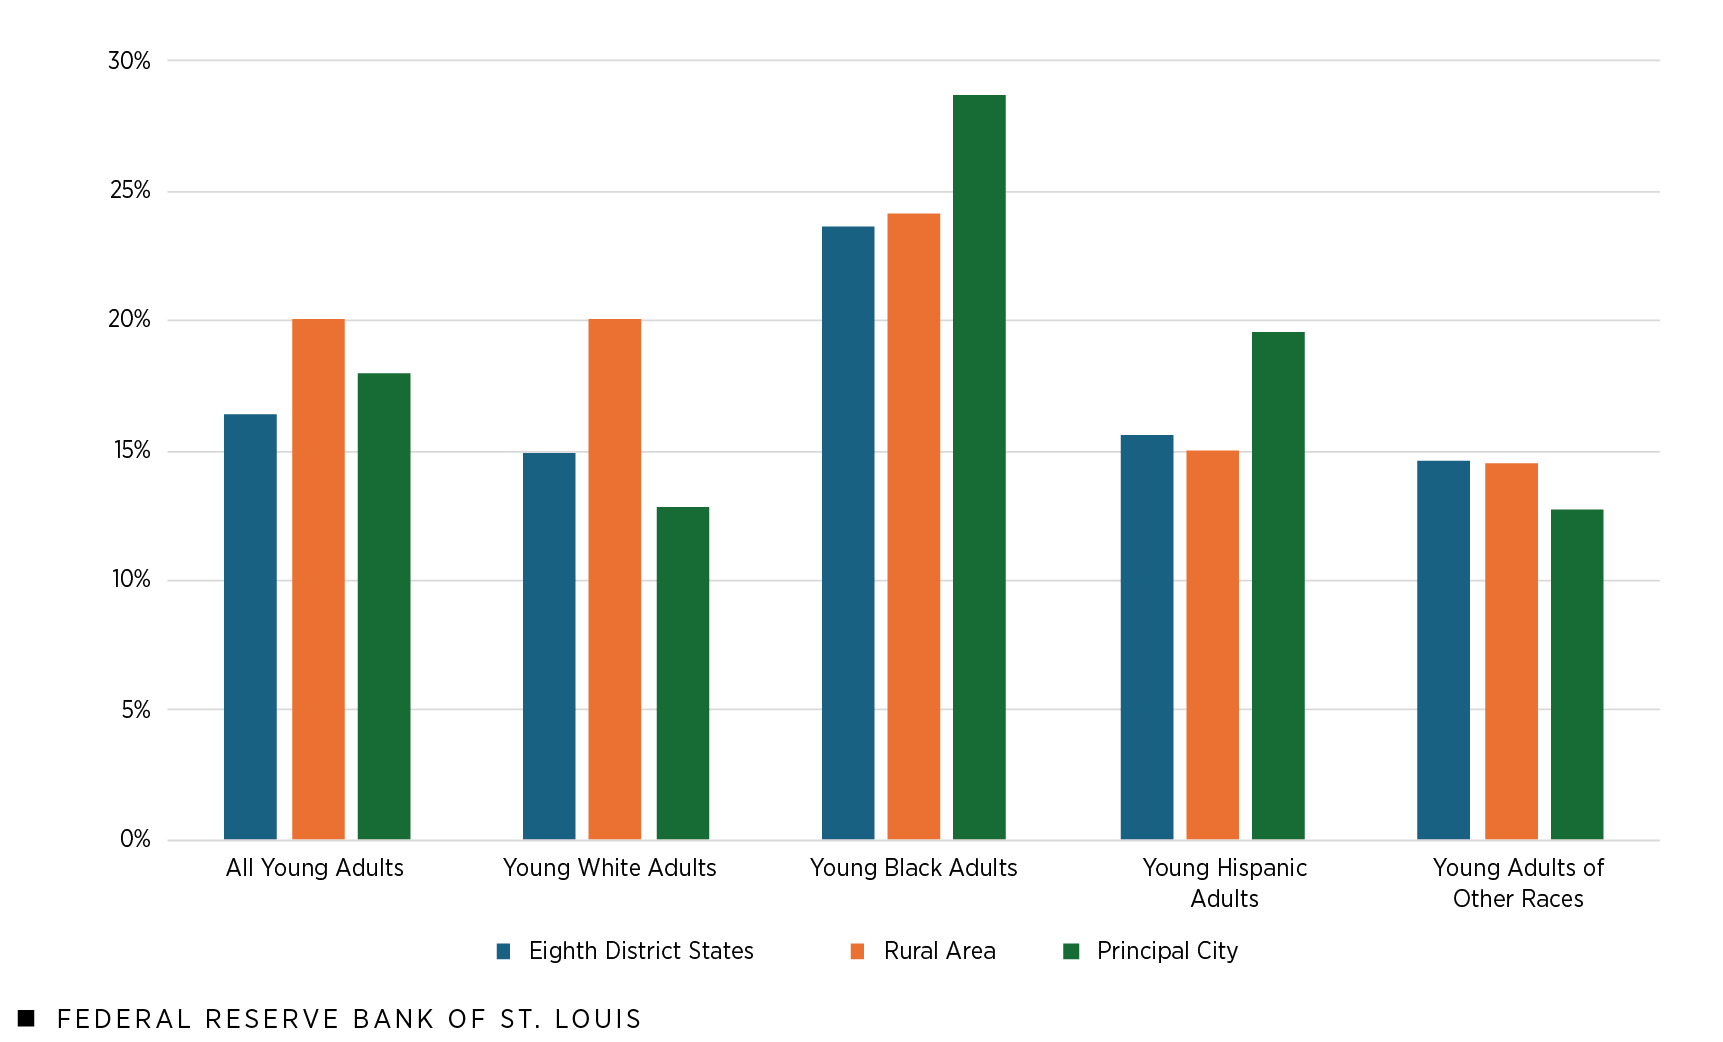
The next two figures report disconnection rates for Eighth District metro areas and their principal cities. The metro areas are Bowling Green, KY; Carbondale-Marion, IL; Evansville, IN-KY; Fayetteville-Springdale-Rogers, AR; Fort Smith, AR-OK; Little Rock-North Little Rock-Conway, AR; Louisville/Jefferson County, KY-IN; Memphis, TN-MS-AR; Pine Bluff, AR; Springfield, MO; and St. Louis, MO-IL. Principal city data were not available for Bowling Green, Carbondale, Fort Smith and Pine Bluff. Due to a small sample size, data are not disaggregated by race/ethnicity. The figures show disconnection rates for two categories of young adults. The first is young adults who meet our basic definition of disconnected: They are ages 18 to 24, not enrolled in high school or college and not employed. The second is young adults who are both disconnected and “inexperienced.” These are young adults who meet our basic definition of disconnected in addition to having two further restrictions: They have no more than a high school diploma and less than 10 years of work experience with age adjustments.This is a standard way to define newer workers. Potential work experience captures new labor force entrants and ranges from zero to 10 years. It reflects factors like age minus years of schooling. Doing this allows a focus on young adults who have the greatest risk of disconnection.
Figure 3: Rates of Disconnection among Eighth District Metro Areas
SOURCES: Current Population Survey microdata from January 2017 to June 2024 and authors’ calculations.
NOTES: Respondents were ages 18 to 24. Disconnected young adults were not enrolled in high school or college, and they were not employed. This includes unemployed on layoff, unemployed but looking for work, and not in the labor force due to retirement, disability or other reasons. Disconnected and inexperienced young adults also have no more than a high school diploma and less than 10 years of labor market experience. All estimates were weighted using the CPS person weights.
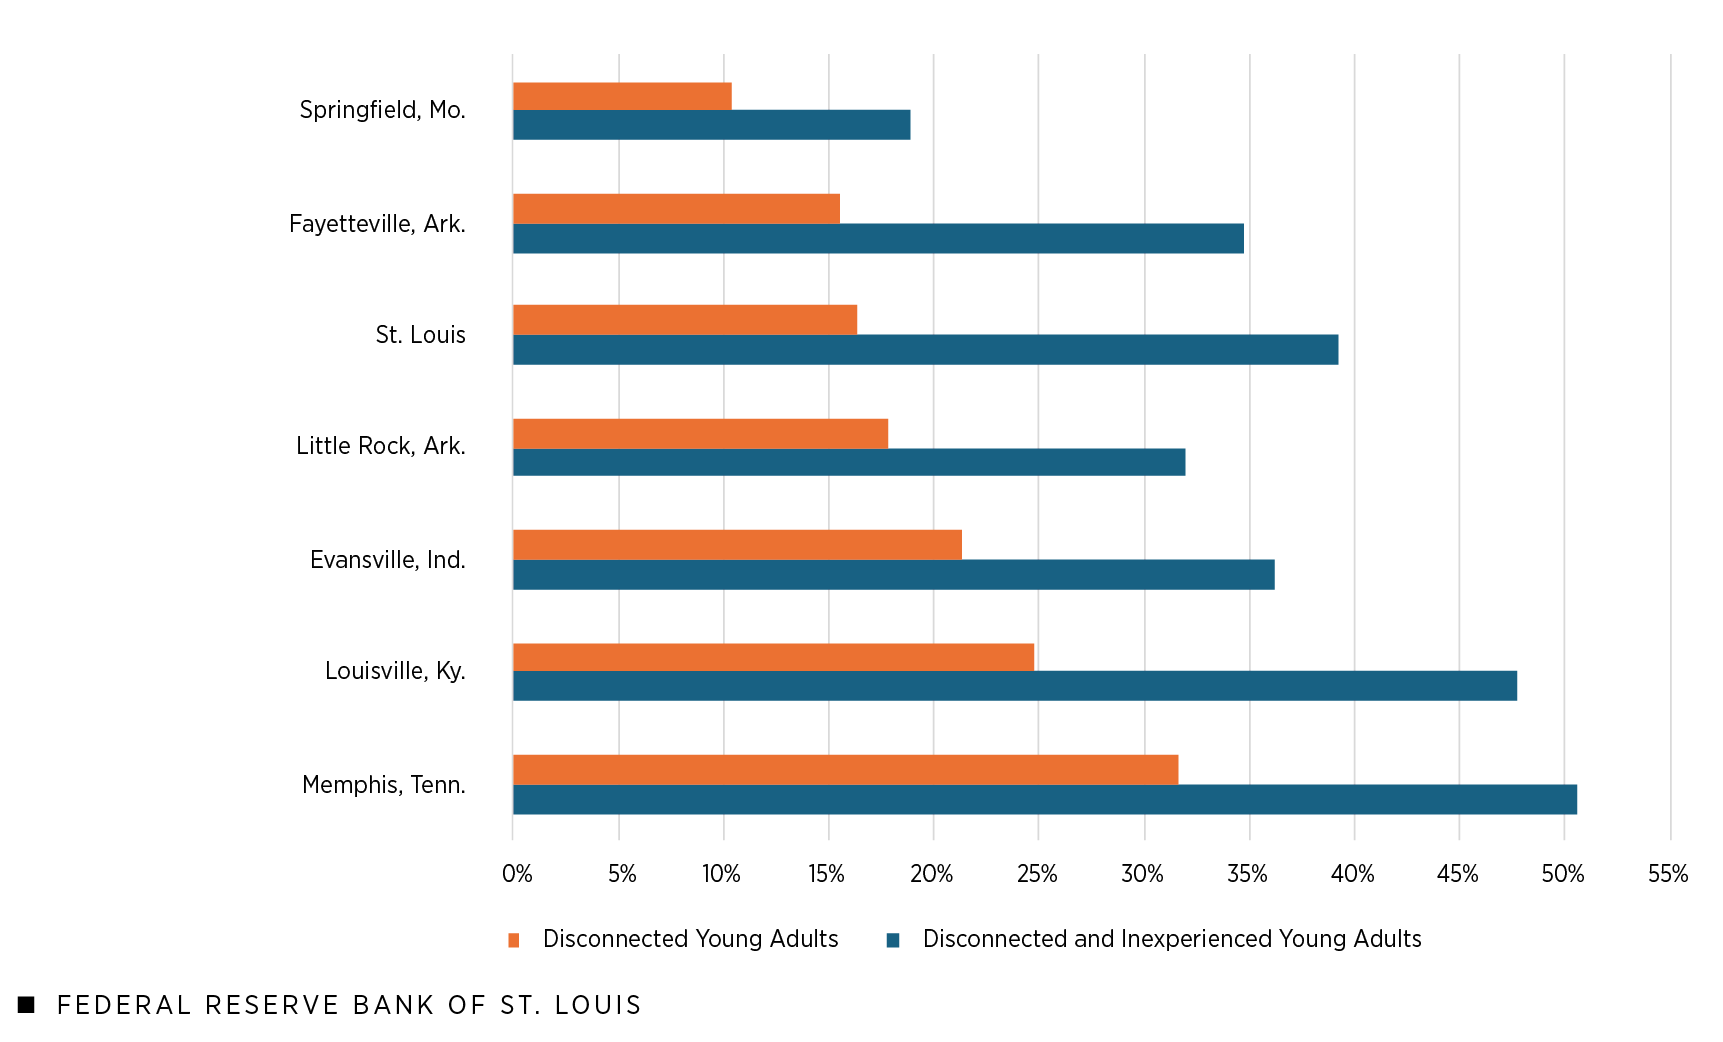
The data consistently suggest that a lack of work experience places young adults at higher risk for disconnection, regardless of geography. Within the Eighth District, the three metro areas with the highest disconnection rates for both disconnected young adults and disconnected and inexperienced young adults were Louisville/Jefferson County, KY-IN (22%, 44.5%); Fort Smith, AR-OK (24.6%, 40.8%); and Memphis, TN-MS-AR (24.9%, 44%) (Figure 3). Among the principal cities in the Eighth District, those with the highest rates of disconnected young adults and disconnected and inexperienced young adults were Evansville, Ind. (21.3%, 36.2%); Louisville, Ky. (24.8%, 47.7%); and Memphis, Tenn. (31.6%, 50.6%) (Figure 4). The rates in Louisville and Memphis are especially concerning because they suggest that 1 out of every 4 and 1 out of every 3 young adults, respectively, are disconnected. If those young adults have limited education and work experience, the numbers are closer to every 1 in 2 young adults.
Figure 4: Rates of Disconnection among Eighth District Principal Cities
SOURCES: Current Population Survey microdata from January 2017 to June 2024 and authors’ calculations.
NOTES: Respondents were ages 18 to 24. Disconnected young adults were not enrolled in high school or college, and they were not employed. This includes unemployed on layoff, unemployed but looking for work, and not in the labor force due to retirement, disability or other reasons. Disconnected and inexperienced young adults also have no more than a high school diploma and less than 10 years of labor market experience. All estimates were weighted using the CPS person weights. Principal cities in Eighth District metro areas for which data are available are Evansville, Ind.; Fayetteville, Ark.; Little Rock, Ark.; Louisville, Ky.; Memphis, Tenn.; Springfield, Mo.; and St. Louis.
Young Adult Disconnection Rates by Sociodemographic Characteristics
Figure 5 and Figure 6 report young adult disconnection rates across various sociodemographic characteristics at the national and Eighth District levels, respectively, including educational attainment, race/ethnicity, sex, household income, disability status and time of the year by month. These rates are further disaggregated across rural areas and principal cities. Even further disaggregation—for example, by race and sex across variables like educational attainment or income—was not possible due to low sample size.
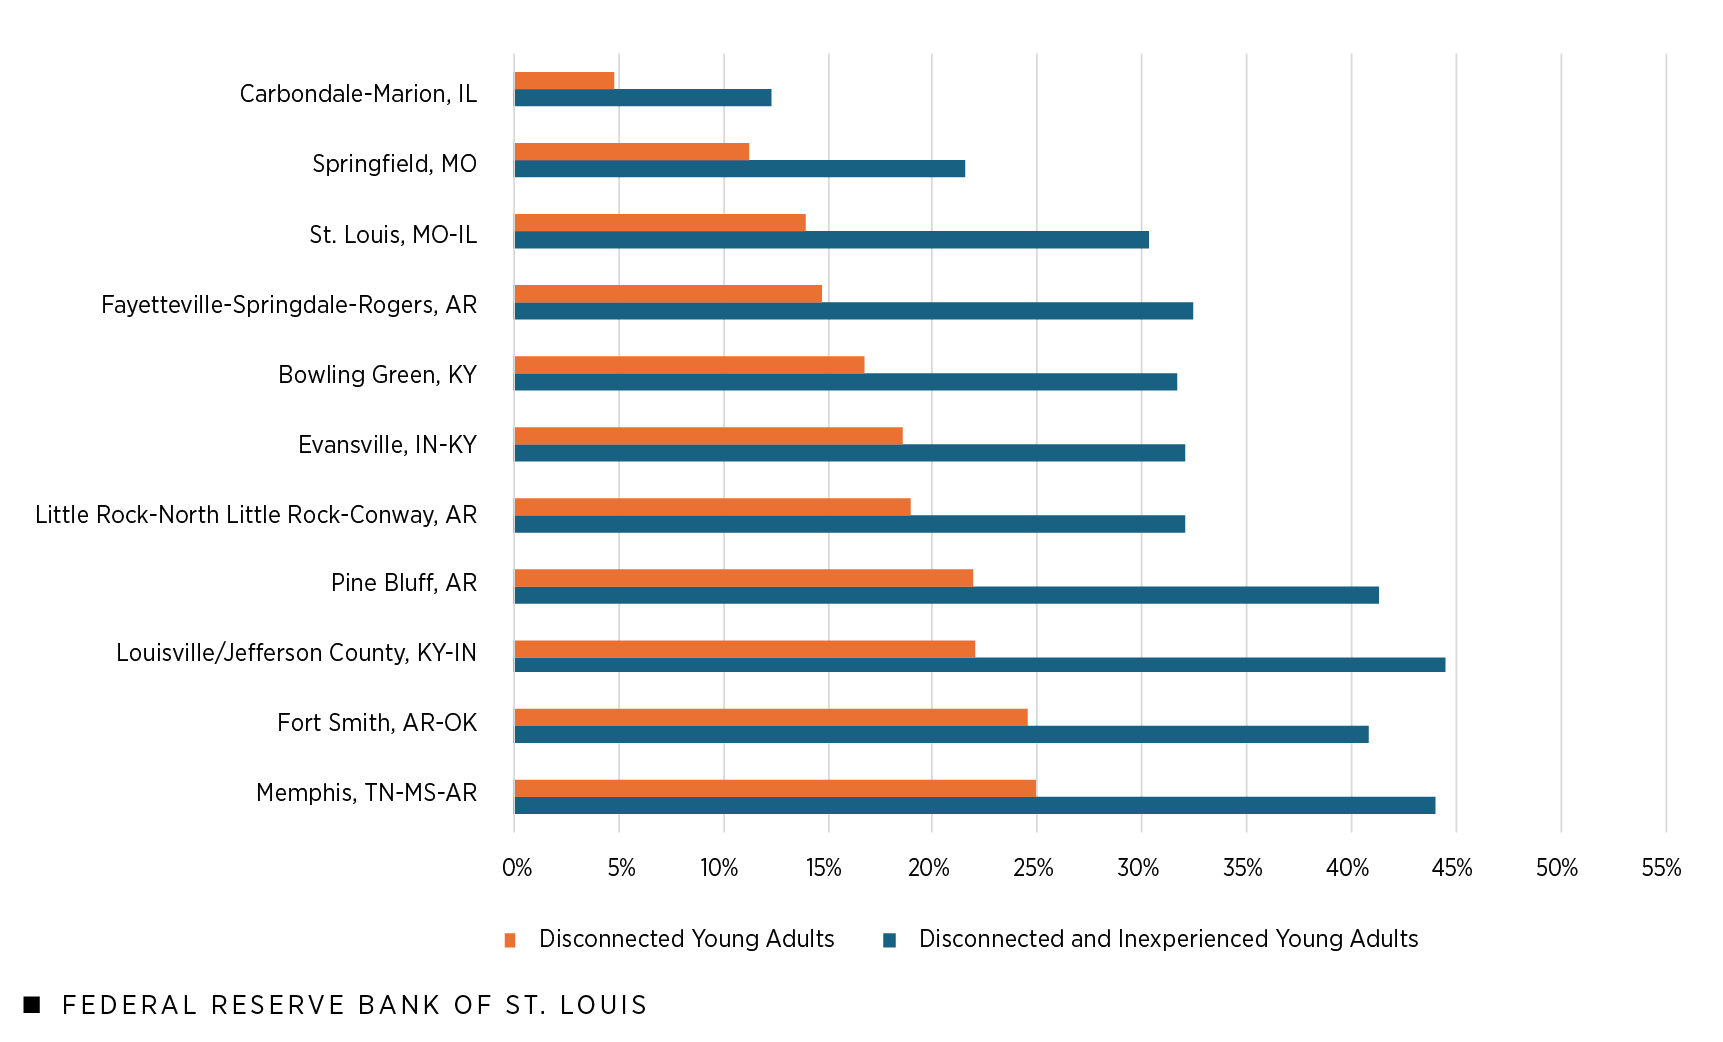
Figure 5: U.S. Young Adult Disconnection Rates by Sociodemographic Characteristics and Geography
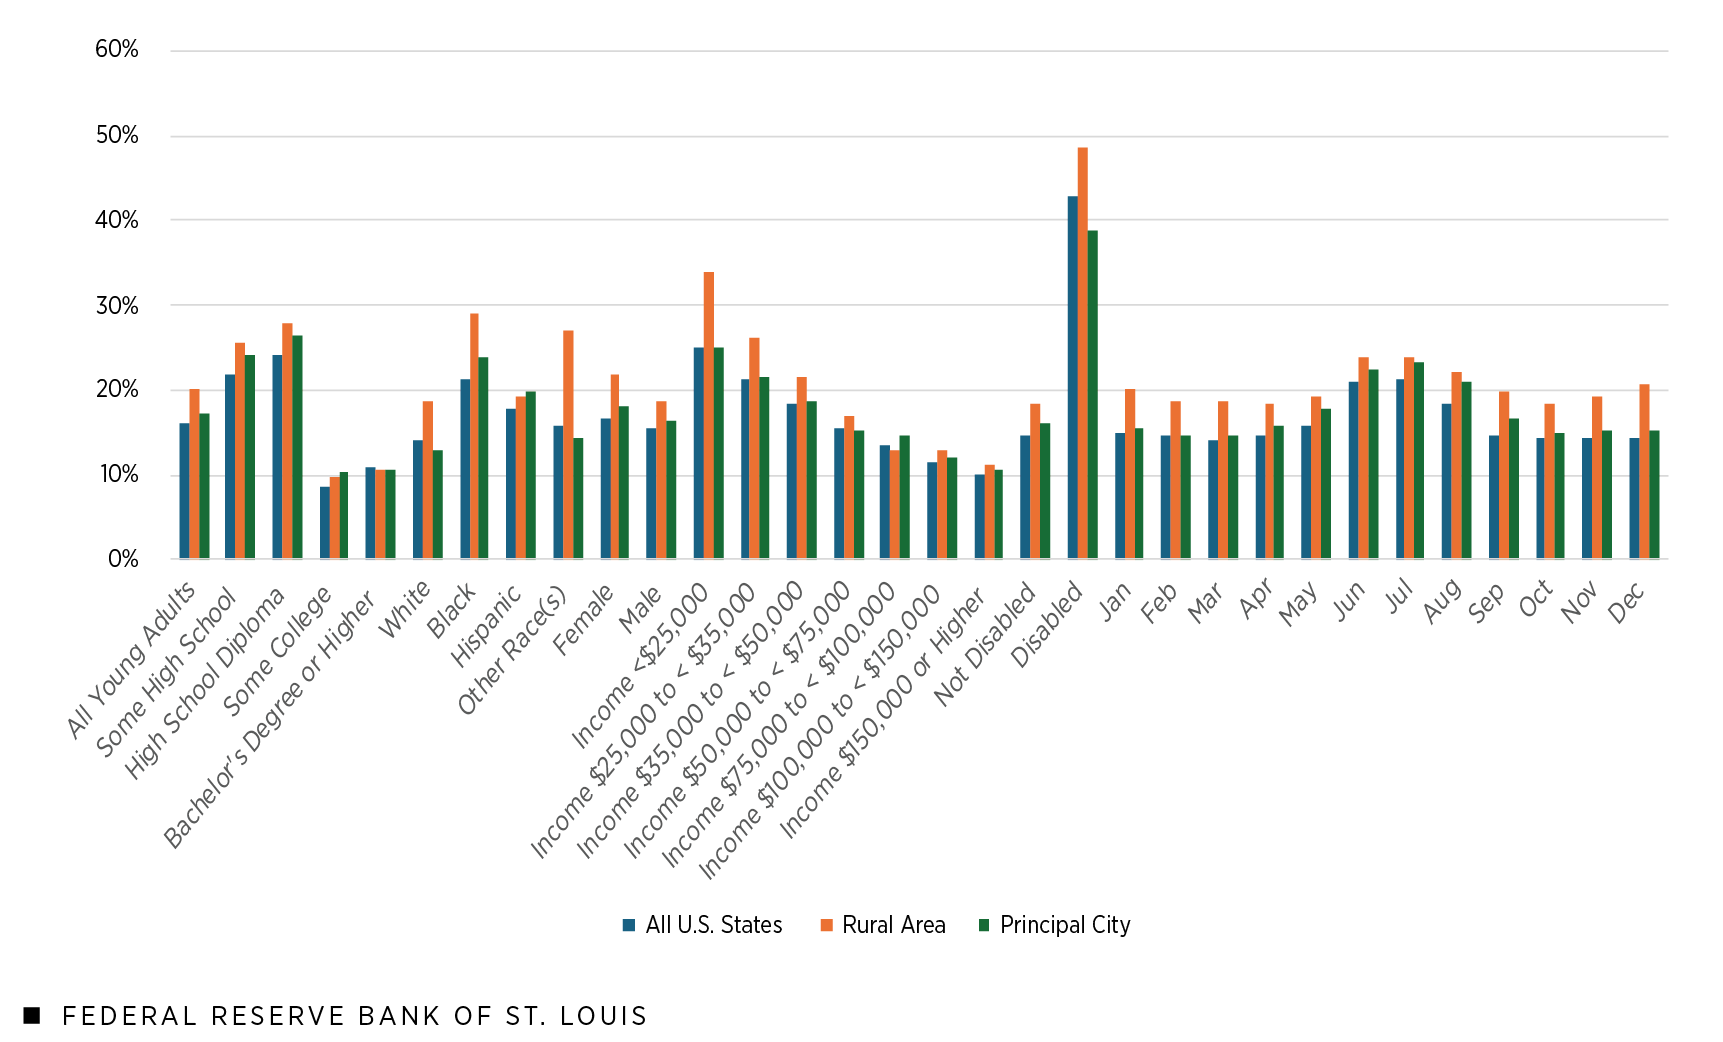
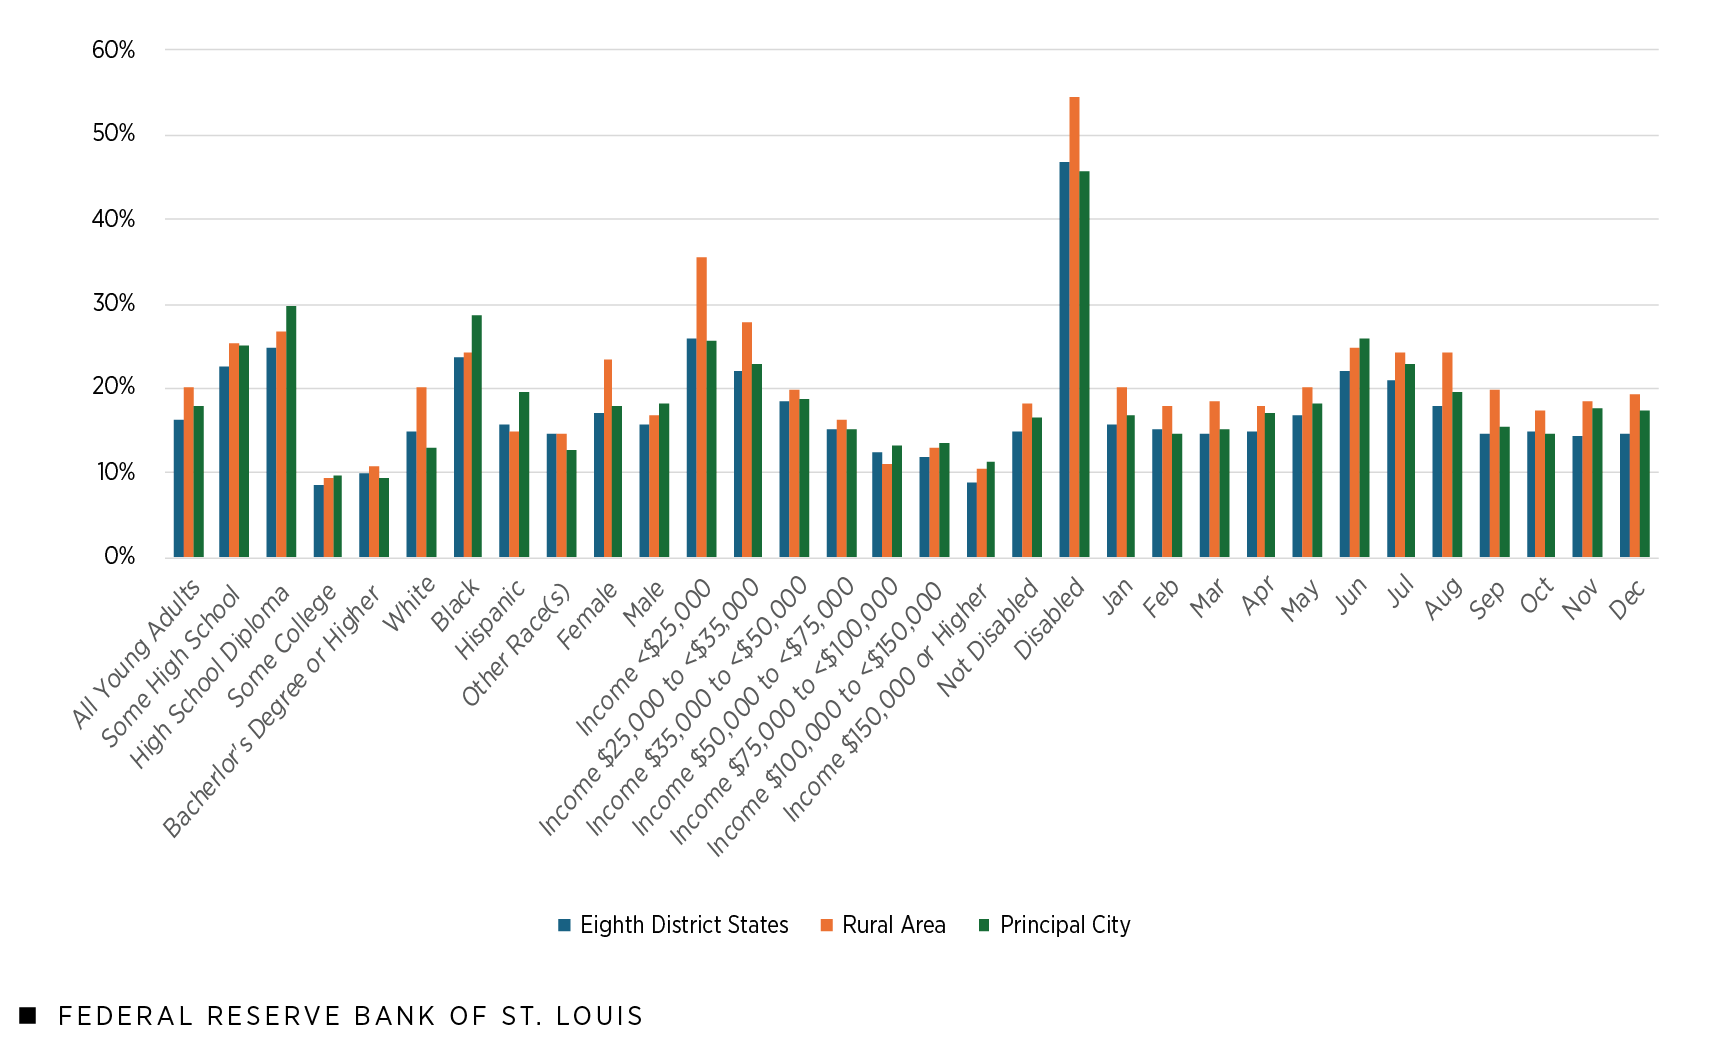
Figure 6: Young Adult Disconnection Rates for Eighth District States by Sociodemographic Characteristics and Geography
SOURCES FOR THE TWO FIGURES: Current Population Survey microdata from January 2017 to June 2024 and authors’ calculations.
NOTES FOR THE TWO FIGURES: Respondents were ages 18 to 24. Disconnected young adults were not enrolled in high school or college, and they were not employed. This includes unemployed on layoff, unemployed but looking for work, and not in the labor force due to retirement, disability or other reasons. All estimates were weighted using CPS person weights. The Eighth District states are Arkansas, Illinois, Indiana, Kentucky, Mississippi, Missouri and Tennessee. Rural designates those living outside metro areas. Principal city designates those living in the largest city within each of 260 metro areas identified in the CPS. Principal cities in Eighth District metro areas for which data are available are Evansville, Ind.; Fayetteville, Ark.; Little Rock, Ark.; Louisville, Ky.; Memphis, Tenn.; Springfield, Mo.; and St. Louis.
Education
At the national level, disconnection rates were highest for young adults who did not graduate from high school (21.9%) and those with no more education than having earned a high school diploma (24.3%). Disconnection rates in rural areas (25.7% for young adults with some high school and 27.9% for those with no more than a high school diploma) and cities (24.1% for young adults with some high school and 26.4% for those with no more than a high school diploma) were slightly higher than the U.S. average (Figure 5).
Similar patterns appeared at the Eighth District level, where young adults who did not graduate high school (22.6%) and those with no more than a high school diploma (24.8%) had the highest disconnection rates. Disconnection rates in rural areas (25.3% for young adults with some high school and 26.6% for those with no more than a high school diploma) and cities (25.1% for young adults with some high school and 29.8% for those with no more than a high school diploma) were higher than the average across Eighth District states (Figure 6).
Curiously, rates of disconnection were slightly higher for those who earned a high school diploma than they were for those who did not. However, both the national and Eighth District data suggest that those with college experience—even just some college experience—have lower disconnection rates by half in comparison with young adults with at most a high school diploma.
Race/Ethnicity
A brief survey of the data reveals that young Black adults generally had higher disconnection rates than young white adults, young Hispanic adults or young adults in the “other” racial group. Nationally, the disconnection rate among young Black adults was 21.4%, with higher rates in rural areas (29%) and cities (23.8%) (Figure 5).
Within Eighth District states, the rate of disconnection for young Black adults was 23.6%. It was again higher in rural areas (24.2%) and cities (28.6%) (Figure 6). The disconnection rate for young Black adults living in Eighth District cities was more than double that of their white counterparts (12.8%) and also higher than that of young Hispanic adults (19.6%).
Sex
By sex and geography, young adult women living in rural areas had the highest disconnection rates both nationally (21.9%) and in the Eighth District (23.3%) (Figure 5 and Figure 6, respectively). While this runs counter to what is often found in the literature, it may highlight disparities faced by young women in rural communities, where fewer child care options and career opportunities exist.
Family Income
Family income had a powerful effect on disconnection rates nationally (Figure 5) and within Eighth District states (Figure 6). Regardless of geography, U.S. and Eighth District disconnection rates fell steadily as annual family income rose. This drop was most pronounced in rural communities. In 2023, the real median family income in the U.S. was $100,800. Disconnection rates were highest (33.9% nationally and 35.5% in the Eighth District) when young adults in rural areas came from a family with income of less than $25,000. However, when young adults in rural areas came from families with incomes of more than $100,000 and less than $150,000—that is, close to or above the median—disconnection rates were much lower, at 13% nationally and 12.9% within the Eighth District.
Compared with young adults in rural areas, young adults in cities generally had lower, but still relatively high, disconnection rates when family income is considered. The disconnection rates for young adults living in cities and from families with annual income of less than $25,000 were 25% nationally and 25.6% in the Eighth District. However, when young adults in cities fell within the family income range of $100,000 to less than $150,000, which just includes the real median family income in the U.S., rates of disconnection were much lower, at 12% nationally and 13.4% in the Eighth District. In short, young adults from rural communities generally had higher disconnection rates regardless of annual family income; however, as family income increases, those rates fell drastically.
Disability Status
Regardless of geography, young adults who reported a disability had exceedingly high disconnection rates. Nationally, their rate of disconnection was 43%. Young adults with disabilities in rural areas and cities had disconnection rates of 48.7% and 39%, respectively (Figure 5). To put these rates into context, the disconnection rates for U.S. young adults without a disability were roughly a third the size: 14.7% nationally, 18.3% in rural areas and 16.1% in cities.
At 46.8%, the disconnection rate for young adults with disabilities averaged across Eighth District states was even higher than the national number (Figure 6). The disconnection rates for young adults with disabilities were 54.4% in rural areas of the Eighth District and 45.6% in Eighth District cities. In addition, the disconnection rates for Eighth District young adults without a disability were closer to half or a third the size of those for young adults with a disability: 14.8% in the Eighth District as a whole, 18.1% in rural areas and 16.5% in cities.
Like with other characteristics, young adults with disabilities from rural areas had higher disconnection rates than those from cities. Factors that may place young adults with disabilities at such high risk of disconnection include poor access to transportation, a lack of accommodations for special needs in school and in the workplace, and a lack of work experience or gaps in their employment history.
Seasonality
The last characteristic we examined was seasonality, specifically the time of year by month. As is often demonstrated in the literature, young adult disconnection rates are highest in the summer months of June, July and August. This is true both nationally and within the Eighth District. When the data are disaggregated geographically, rural communities again tended to have higher disconnection rates throughout the year; however, generally, differences between the rates for state averages, rural areas and cities were minimal.
Nationally, the month with the highest disconnection rate was July (21.3%), during which 24% of U.S. young adults in rural areas and 23.3% of those in cities were disconnected (Figure 5). The Eighth District’s highest disconnection rate was in June, although the other summer months trailed closely. The average June disconnection rate for young adults across Eighth District states was 22.1%, with the rate in rural areas at 24.9% and the rate in cities at 26% (Figure 6). Certainly, young adults may engage in undocumented summer work like babysitting, helping at a family business or working on a family farm. However, the summer months may still be an important time to increase opportunities for young adults to engage with the economy and obtain documented work experience to decrease the risk of disconnection when fall arrives.
The Impact of Job Openings on Young Adult Disconnection Rates
With 1 in every 6 young adults in the U.S. on average being disconnected from school and work opportunities, and with certain disconnection rates surging much higher depending on various sociodemographic characteristics like geography, income and disability status, it raises the question of how labor market conditions affect those rates. The next two figures model how a 1 percentage point increase in job openings can lead young adult disconnection rates to fluctuate when data are disaggregated by geography (Figure 7) and by race/ethnicity (Figure 8). The U.S. Bureau of Labor Statistics tracks job openings through the Job Openings and Labor Turnover Survey and calculates the job openings rate, which helps capture employers’ desire or willingness to hire, as the number of job openings on the last business day of the month as a percentage of employment plus job openings. We further disaggregated the data to compare disconnected young adults (again, those ages 18 to 24 and not in school or working) with disconnected and inexperienced young adults (again, those with less education and work experience), who are at higher risk.
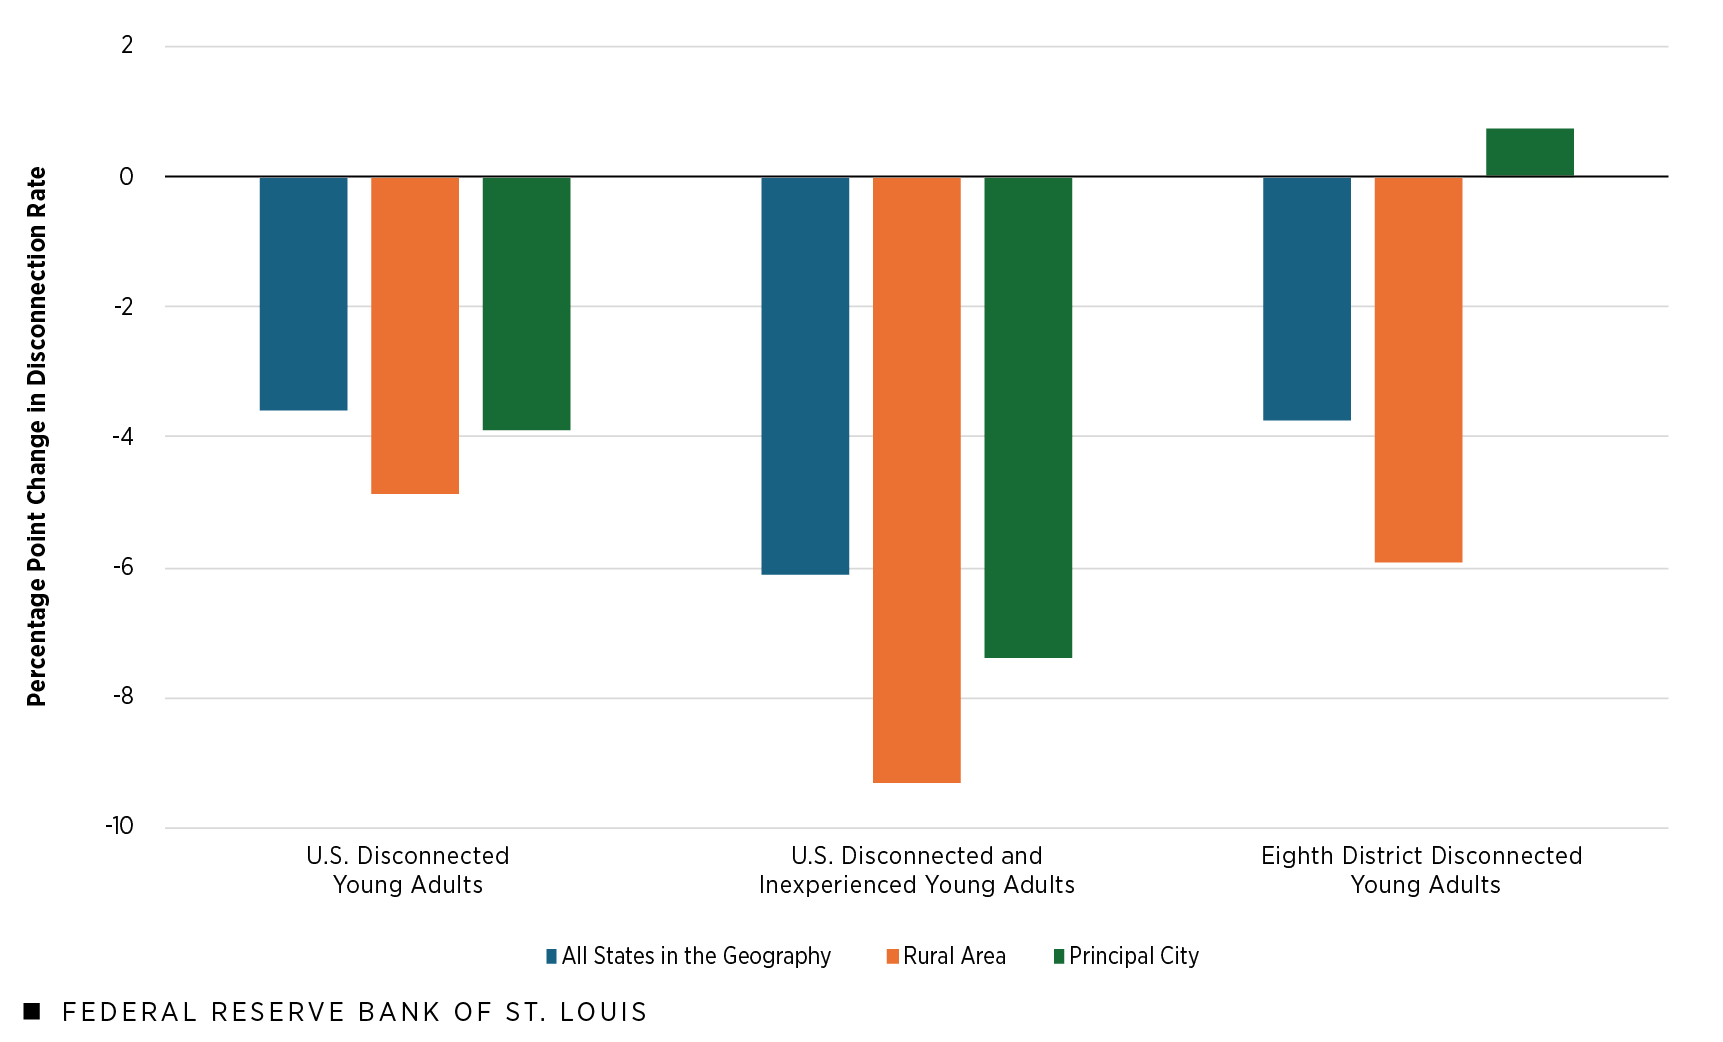
As Figure 7 illustrates, the young adults who would be impacted most by an increase in job openings are those from rural communities. A 1 percentage point increase in job openings would translate into a nearly 5 percentage point reduction in the U.S. disconnection rate for young adults from rural areas, and a decline of almost double that—9.3 percentage points—in the national rate for rural disconnected and inexperienced young adults. Within Eighth District states, the disconnection rate for young adults living in rural areas would fall nearly 6 percentage points. For principal cities, however, estimates from our model are mixed. Nationally, reductions in disconnection rates resulting from a 1 percentage point rise in job openings would reach from 3.9 percentage points for all U.S. young adults living in cities to 7.4 percentage points for those in cities with less education and work experience. Yet, in the Eighth District, the disconnection rate for young adults in cities would see a slight, 0.7 percentage point increase. While the exact reason for this result is unclear, a few different responses may be occurring as job openings in Eighth District principal cities increase. First, for young adults already living in cities, a rise in job openings might not lead to major employment increases if those young adults cannot take advantage of opportunities because of barriers, such as a lack of transportation, that they may experience disproportionately relative to young adults living in suburban or rural areas. As a byproduct, unemployment and disconnection rates may move higher. Another consideration could be that a rise in job openings attracts people to the city to seek new opportunities, thus temporarily inflating disconnection rates.
Figure 7: Change in U.S. and Eighth District Young Adult Disconnection Rates from a 1 Percentage Point Increase in Job Openings by Geography
SOURCES: Current Population Survey microdata from January 2017 to June 2024, Bureau of Labor Statistics and authors’ calculations.
NOTES: Respondents were ages 18 to 24. Disconnected young adults were not enrolled in high school or college, and they were not employed. This includes unemployed on layoff, unemployed but looking for work, and not in the labor force due to retirement, disability or other reasons. Disconnected and inexperienced young adults also have no more than a high school diploma and less than 10 years of labor market experience. All estimates were weighted using the CPS person weights. The Eighth District states are Arkansas, Illinois, Indiana, Kentucky, Mississippi, Missouri and Tennessee. Rural designates those living outside metro areas. Principal city designates those living in the largest city within each of 260 metro areas identified in the CPS. Principal cities in Eighth District metro areas for which data are available are Evansville, Ind.; Fayetteville, Ark.; Little Rock, Ark.; Louisville, Ky.; Memphis, Tenn.; Springfield, Mo.; and St. Louis.
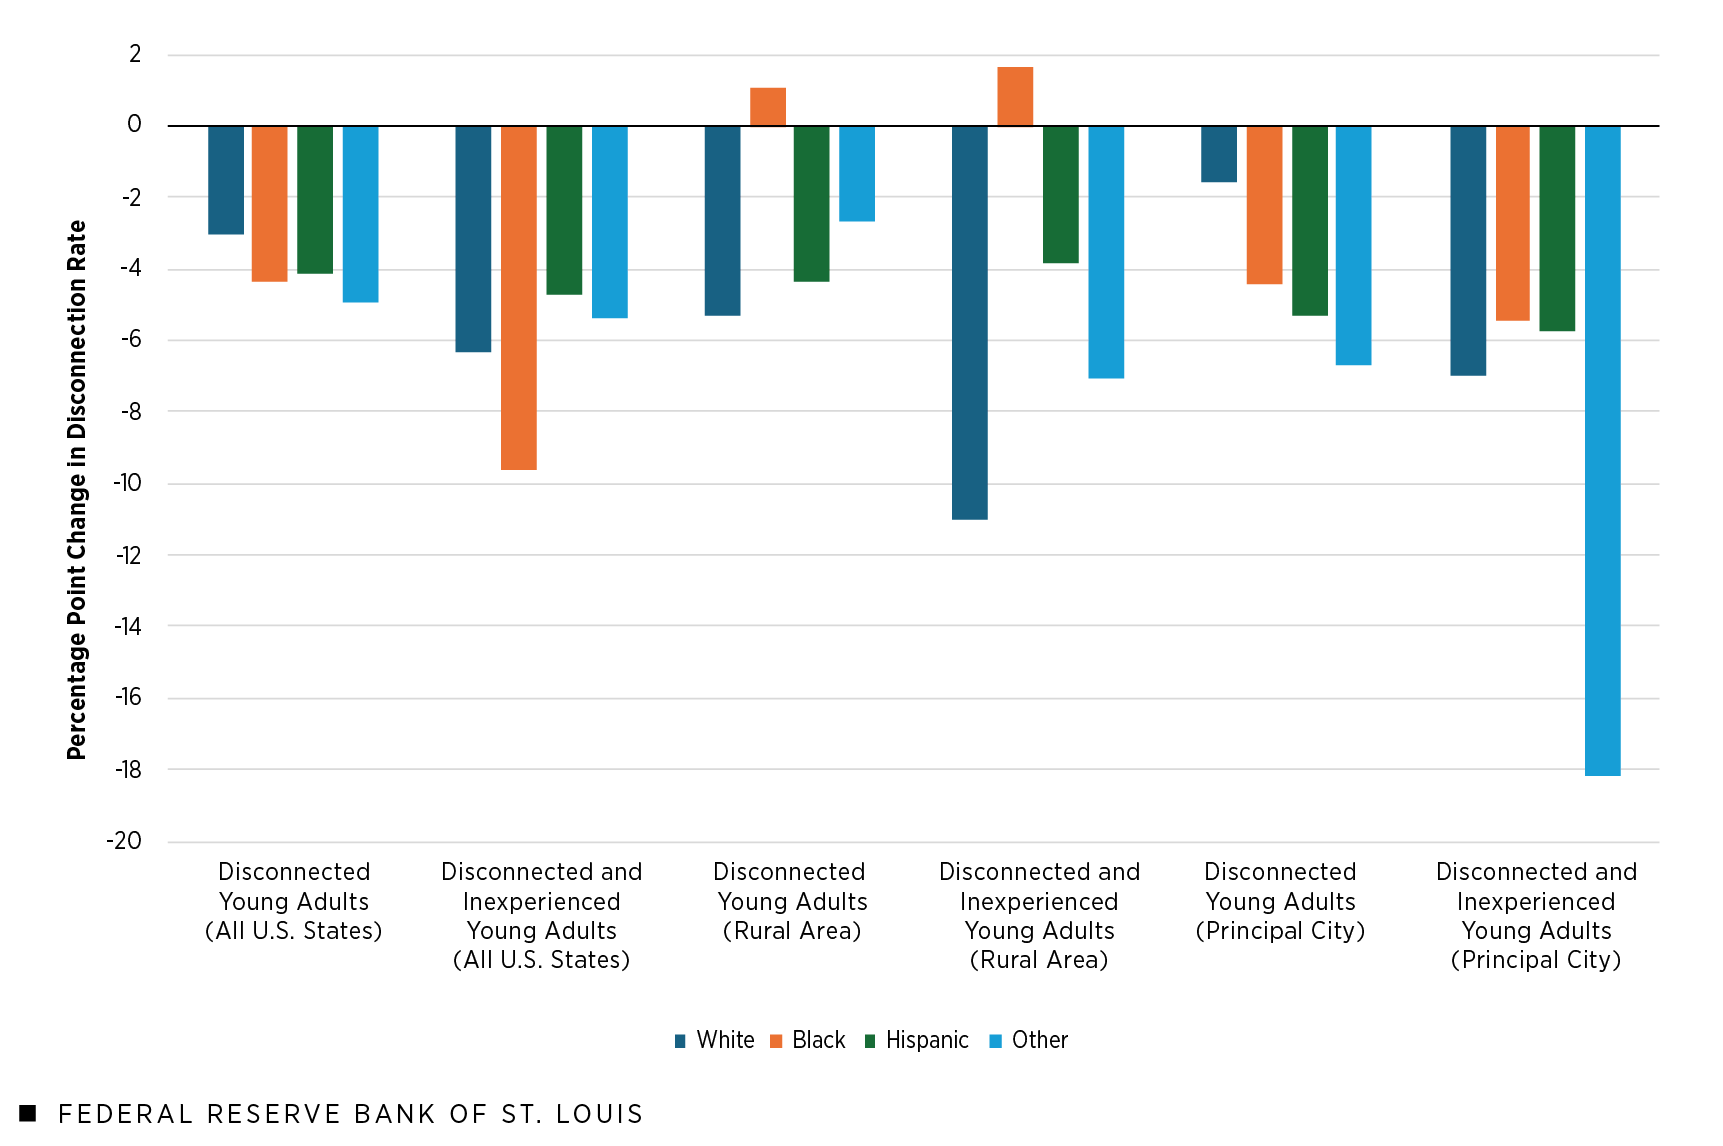
Turning to Figure 8, where estimates are calculated only at the national level due to sample size, curious patterns emerge when the impact of a 1 percentage point increase in job openings is examined by race/ethnicity. The most notable reduction in the rate of disconnection is for young adults from cities with less education and work experience in the “other” racial group, comprising American Indians, Alaska Natives, Asians, Hawaiian/Pacific Islanders and those identifying as unlisted races or multiple races: A 1 percentage point bump in job openings would mean an 18.2 percentage point reduction in their disconnection rate.
An increase in job openings of 1 percentage point would equate to lower disconnection rates for U.S. young adults across all geographies and races/ethnicities except for young Black adults in rural areas. Specifically, the estimates indicate that a 1 percentage point increase in job openings could raise disconnection rates among young Black adults in rural areas by 1 percentage point and among inexperienced young Black adults in rural areas by 1.7 percentage points. Once again, the exact reason behind this result is unclear. However, it is important to consider whether job openings, as they come online, create further disparities between different populations because they exclude certain groups. For instance, if job openings are advertised as entry level but require three to five years of experience, or if applicants must have a bachelor’s degree to apply but do not necessarily need that level of education to perform the duties the position requires, fewer opportunities may be available for new high school graduates to join the workforce directly.
Figure 8: Change in U.S. Young Adult Disconnection Rates from a 1 Percentage Point Increase in Job Openings by Race/Ethnicity
SOURCES: Current Population Survey microdata from January 2017 to June 2024, Bureau of Labor Statistics and authors’ calculations.
NOTES: Respondents were ages 18 to 24. Disconnected young adults were not enrolled in high school or college, and they were not employed. This includes unemployed on layoff, unemployed but looking for work, and not in the labor force due to retirement, disability or other reasons. Disconnected and inexperienced young adults also have no more than a high school diploma and less than 10 years of labor market experience. All estimates were weighted using the CPS person weights. Rural designates those living outside metro areas; principal city designates those living in the largest city within each of 260 metro areas identified in the CPS.
Beveridge Curves and Young Adults’ Structurally Higher Unemployment
In attempting to explain the reasons behind the high disconnection rates among U.S. young adults, it is important to consider whether structural barriers to employment could have emerged and been exacerbated by recent events. Today’s young adults have faced what amounts to two distinct economies early in their working lives: the first marked by a public health emergency and a recession and the second marked by high inflation and the tightest labor market since World War II. A tight labor market means low unemployment and a high job openings, or vacancy, rate.
One way to examine the experiences of young adults further is through Beveridge curves, which represent the relationship between unemployment and vacancy rates. Figure 9 through Figure 12 are constructed to capture Beveridge curves for a period starting before the COVID-19 pandemic and ending in June 2024. Each figure covers a different geography for the entire period and includes data for adults and out-of-school young adults. Despite no longer being in school or working, out-of-school young adults do not yet classify as disconnected; they could be searching for a job, contemplating their next step or taking a break. However, unless individuals in this unique group either enter the labor market or continue their education, they soon will be disconnected. Looking at out-of-school young adults in conjunction with unemployment data can offer insight into the group’s labor market experiences. The Beveridge curves in this report reflect four distinct phases based on the unemployment rate, with a potential fifth phase emerging:
- Prepandemic (January 2017 to March 2020)Although March 2020 is generally considered the start of the pandemic in the U.S., the full impact of COVID-19 on employment isn’t wholly reflected in that month’s data, so it has been excluded from the early pandemic period.
- Early pandemic (April 2020 to July 2020)
- Labor market recovery (August 2020 to March 2022)
- Tight labor market (April 2022 to April 2024)
The job search process for out-of-school young adults looked different over these four phases. The first phase was characterized by a strong labor market and serves as a prepandemic baseline.For more on conditions during this first phase, see our July 14, 2022, On the Economy post, “What Does the Beveridge Curve Tell Us about the Labor Market Recovery?” The second phase saw a massive jump in unemployment due to effects of the pandemic and governments’ COVID-19 restrictions. The third phase was one of rapid reductions in unemployment as people returned to work, mandatory stay-at-home orders expired, nonessential businesses reopened, and our knowledge of living and working within the confines of social distancing improved. It was also a time when firms competed for workers, pushing up wages and compensation, increasing unemployment’s opportunity cost. Additionally, there was a larger-than-expected number of retirements among older workers. Finally, during the fourth phase, the job search process became less sensitive to the number of vacancies, and further reductions in unemployment required larger increases in job openings. While this relationship was correlational rather than causal, it is consistent with what a Beveridge curve would predict. In this phase, competition for available workers increased. Labor shortages gave workers bargaining power, and many switched jobs.
New labor market conditions may have started emerging in May 2024—beginning a potential fifth phase—as unemployment rates increased, especially for out-of-school young adults. However, it is too early to tell if this marks the start of a new labor market or will turn out to be fluctuations within the most recent phase.
When comparing the Beveridge curves of out-of-school young adults with those of other adults, our results in the following figures show that even though young adults’ job search efficiency returned to its prepandemic position by the end of the full period, their unemployment rate at a given rate of job openings tended to exceed the all-adult jobless rate.
Figure 9: Beveridge Curves for the U.S., January 2017-June 2024
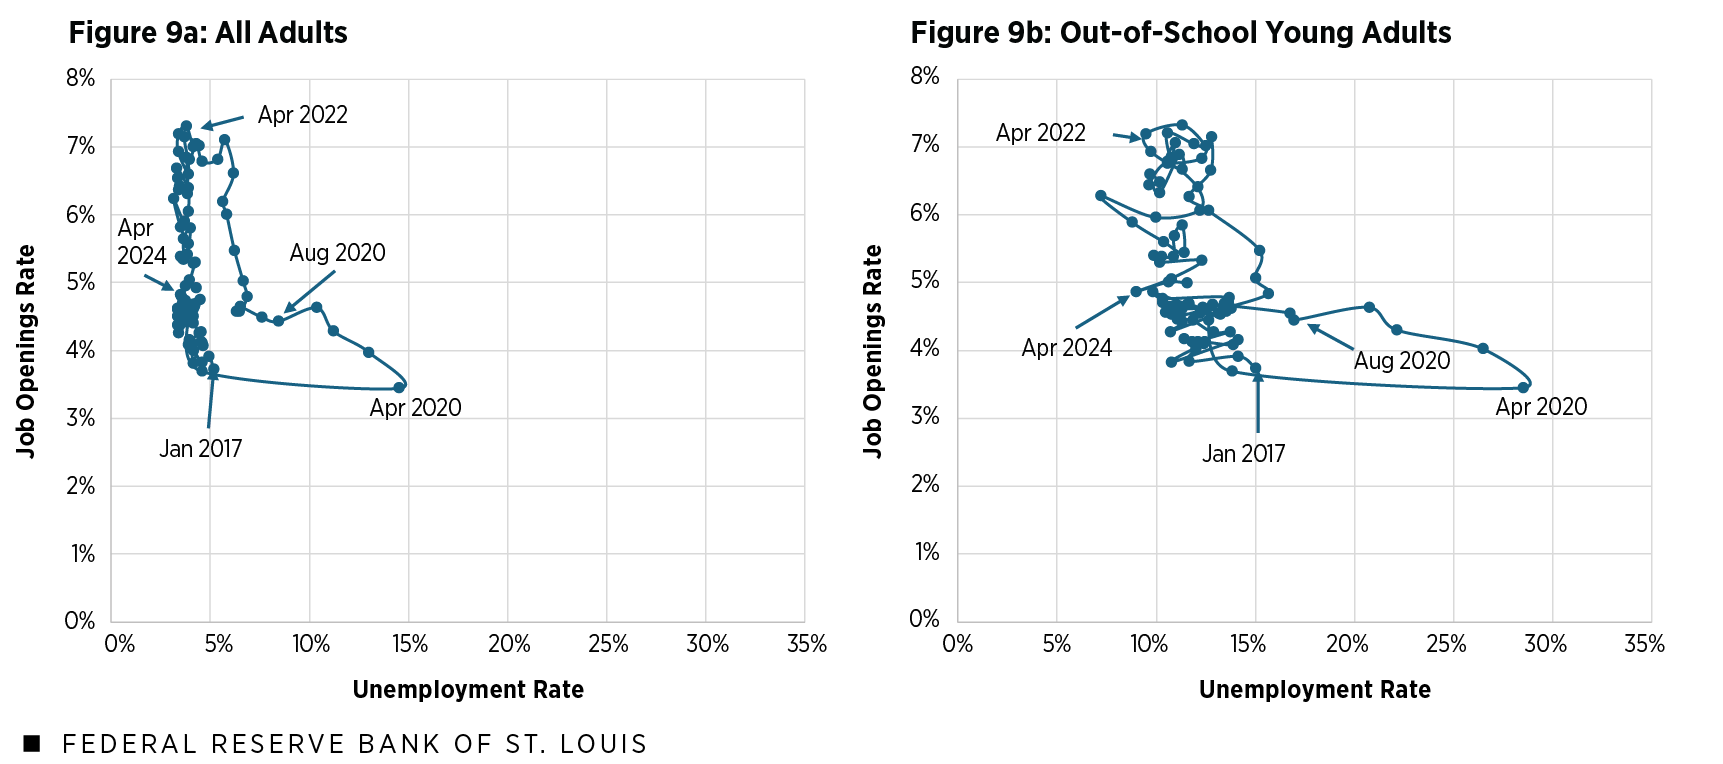
Figure 10: Beveridge Curves for U.S. Rural Areas, January 2020-June 2024
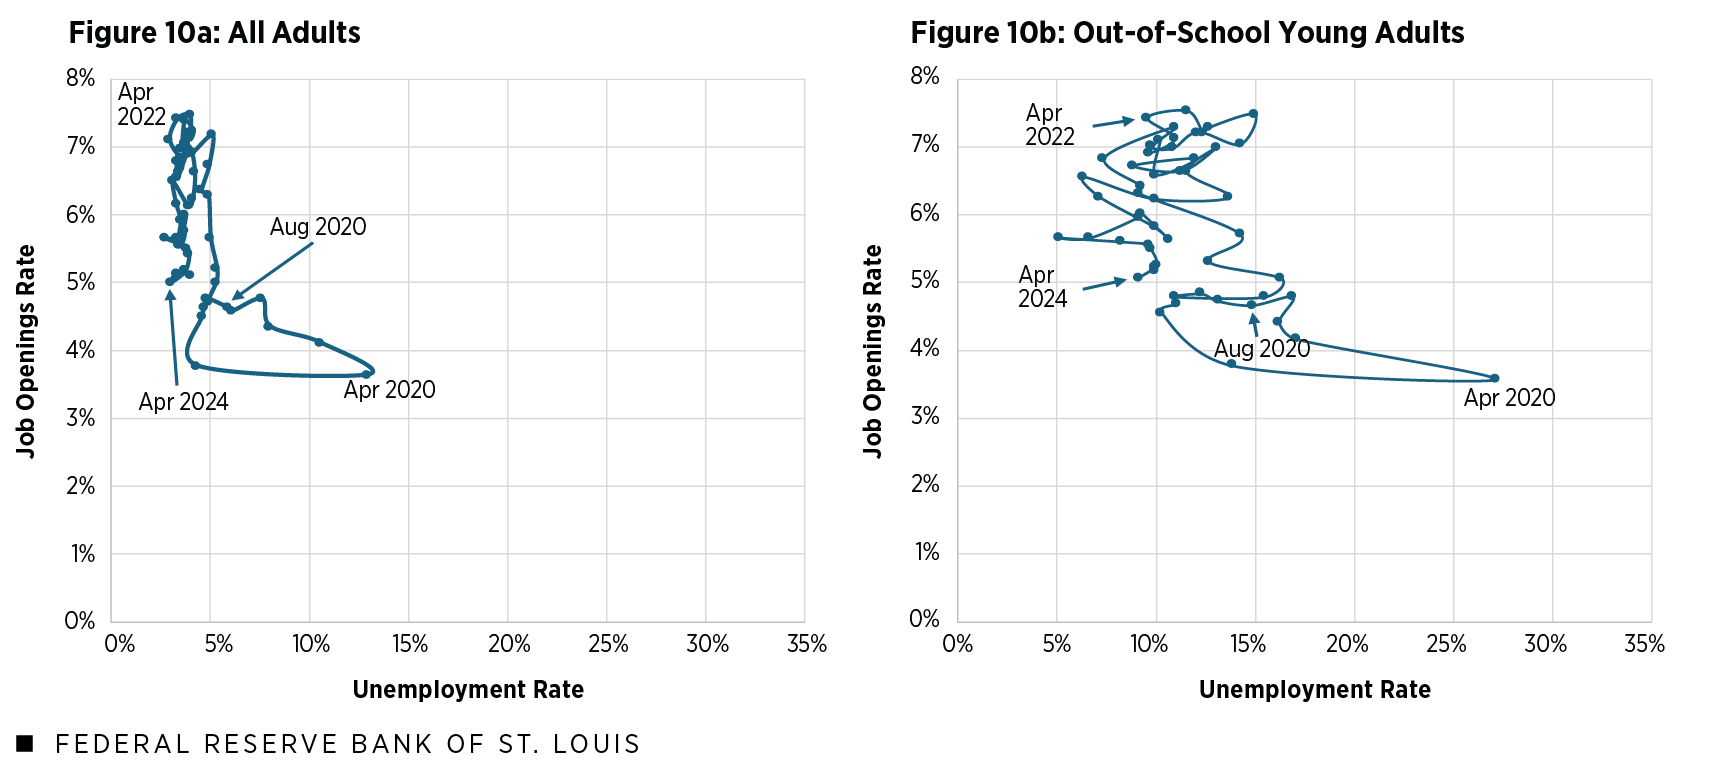
Figure 11: Beveridge Curves for Principal Cities in U.S. Metro Areas, January 2020-June 2024
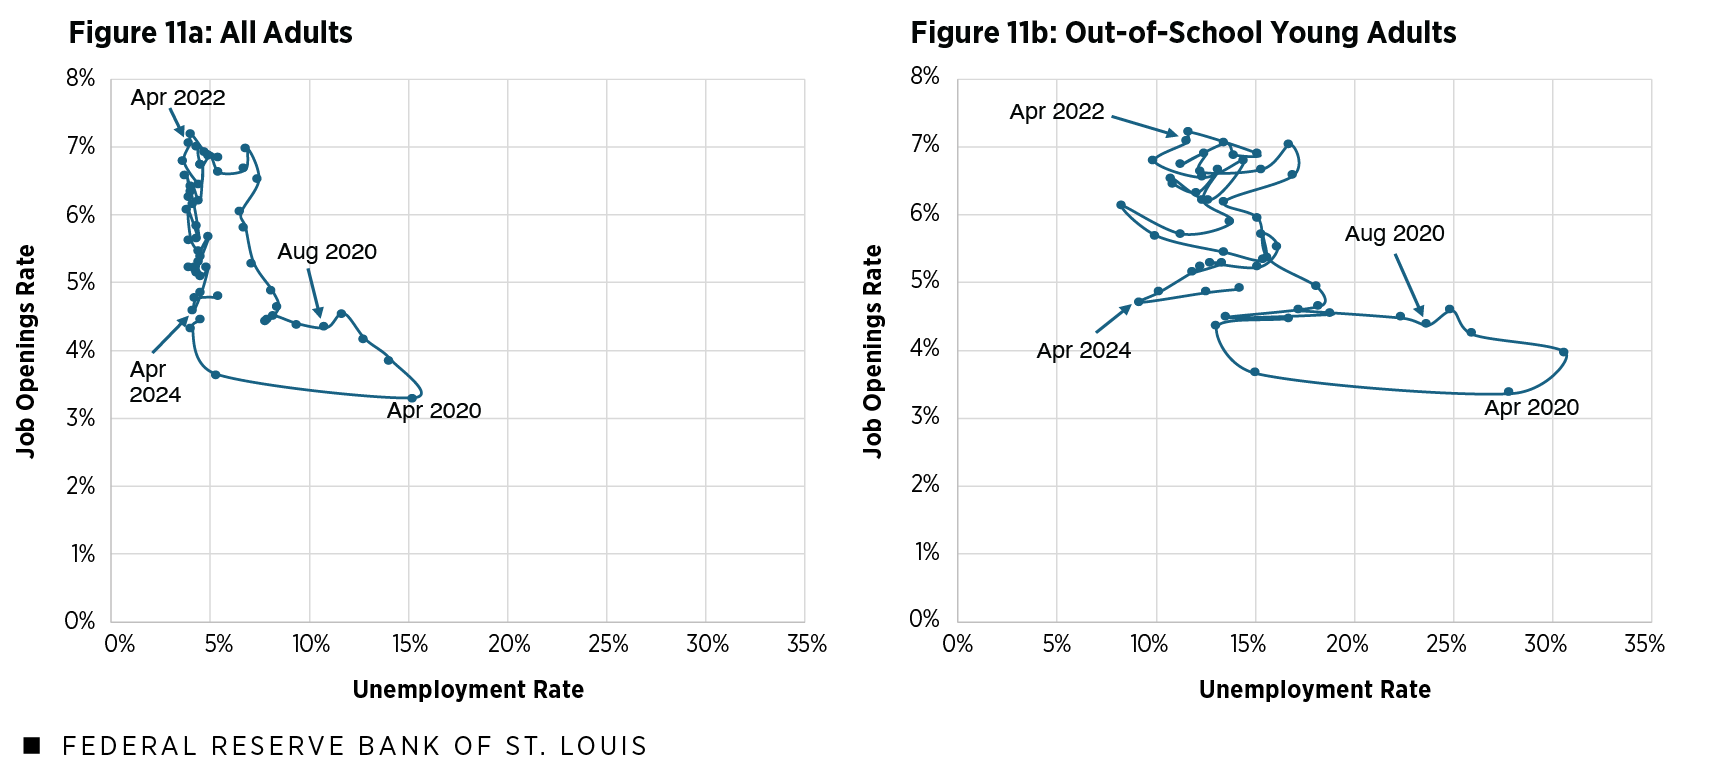
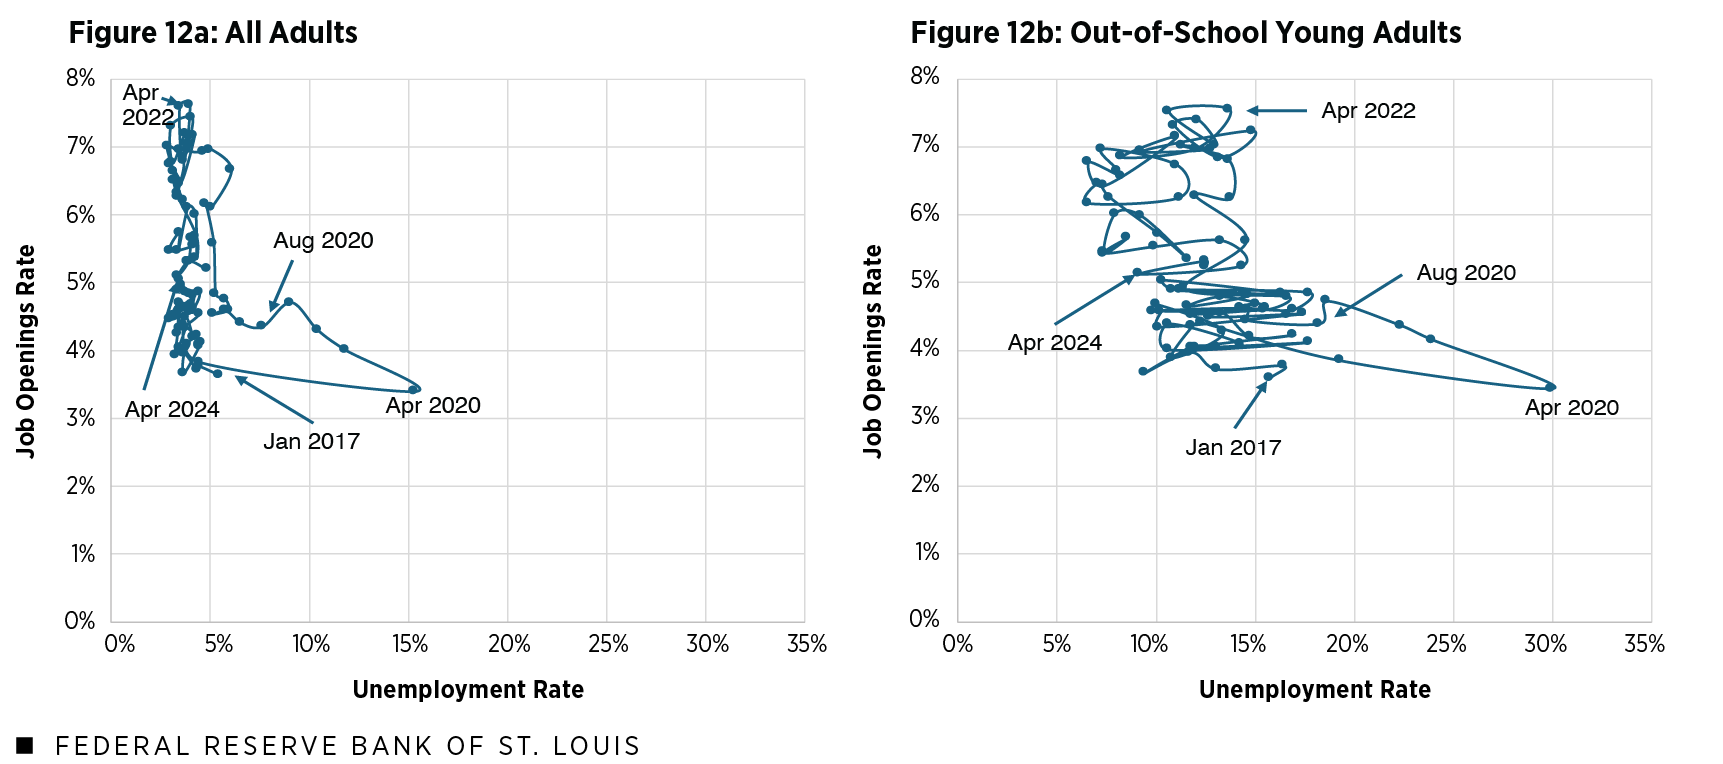
Figure 12: Beveridge Curves for Eighth District States, January 2017-June 2024
SOURCES FOR THE FOUR FIGURES: Current Population Survey microdata, Bureau of Labor Statistics and authors’ calculations.
NOTES FOR THE FOUR FIGURES: Data for Figure 9 and Figure 12 are from January 2017 to June 2024. Data for Figure 10 and Figure 11 are from January 2020 to June 2024, which was the earliest available for those geographies. Rural designates those living outside metro areas; principal city designates those living in the largest city within each of 260 metro areas identified in the CPS. The Eighth District states are Arkansas, Illinois, Indiana, Kentucky, Mississippi, Missouri and Tennessee.
During the overall period’s early pandemic phase—one characterized by COVID-19 shutdowns—the national unemployment rate was 14.5% at its worst for all adults (Figure 9a) but 28.5% at its worst for out-of-school young adults (Figure 9b). The same story emerges for U.S. rural areas; the national unemployment rate at its worst for all adults was 13% (Figure 10a) and 27.1% at its worst for out-of-school young adults (Figure 10b). For principal cities across the U.S., the all-adult unemployment rate at its highest was 15.3% (Figure 11a) and the unemployment rate for out-of-school young adults at its highest was 30.6%, or nearly 1 in 3 young adults (Figure 11b). Finally, for Eighth District states, unemployment rates at their worst were 15.4% for all adults (Figure 12a) but about double that (30.1%) for out-of-school young adults (Figure 12b). As the nation continues returning to normal, unemployment rates may fully revert to prepandemic levels for both all adults and young adults who are not in school. However, the consistently higher unemployment rates among out-of-school young adults present an opportunity to improve their economic participation.
The Current Picture: June 2024 Labor Market Outcomes for Young Adults
A glimpse at the most recent data for all adults and out-of-school young adults suggests that labor force participation continues to be disproportionate. Figure 13 uses CPS data to show that young adults who are not in school have consistently lower labor force participation—as measured by employment-population ratio—regardless of geography. Data for June 2024 suggest that while 74.5% of U.S. adults were employed, only 59.1% of U.S. out-of-school young adults were. Nationally, the employment gap between all adults and out-of-school young adults was 17.6 percentage points in cities and 9.7 percentage points in rural areas.
In the Eighth District states, the gap in employment-population ratios between all adults and young adults not in school ranged from 5.6 percentage points to 25.1 percentage points for all geographies (based on June 2024 data), with the gap most pronounced in urban areas. While Figure 13 describes labor force participation rather than unemployment, the story is similar and may point to deep structural issues hindering young adults’ contribution to the workforce.
Figure 13: Employment-Population Ratios by Geography, U.S. and Eighth District

SOURCES: Current Population Survey microdata and authors’ calculations.
NOTES: U.S. and Eighth District data are estimated labor market outcomes for June 2024. The CPS sample weights are used. The Eighth District states are Arkansas, Illinois, Indiana, Kentucky, Mississippi, Missouri and Tennessee. The following relationship is helpful for understanding these estimates: employment-population ratio = (1 minus unemployment rate) × labor force participation rate.
- The Eighth District includes all of Arkansas, southern Illinois, southern Indiana, western Kentucky, northern Mississippi, eastern Missouri and western Tennessee.
- See the April 6, 2023, Dallas Fed article, “Young Adults Are Disconnected from Work and School Due to Long-term Labor Force Trends.” These percentages exclude June-August data to avoid mistaking students as disconnected in the summer.
- This calculation is based on CPS data in the March Annual Social and Economic Supplement rather than aggregated monthly CPS microdata. When young adults who are enrolled in school are excluded, these estimates fall but still show an upward trend.
- This calculation includes the summer months of June through August and uses monthly CPS microdata aggregated from January 2017 to June 2024.
- See the March 7, 2023, On the Economy post, “Understanding the Cases for Economic Equity.”
- See Ashley Palmer and John Connolly’s November 2022 article in Child and Adolescent Social Work Journal, “Beyond ‘Disconnected Youth’: Characterizing Developmental Heterogeneity in School or Work Connections during Emerging Adulthood,” and Kristen Lewis’ April 2019 Social Science Research Council report, Making the Connection: Transportation and Youth Disconnection (PDF).
- See our Aug. 15, 2024, On the Economy post, “Not Working, Out-of-School Young Adults in the U.S. by Race and Geography.”
- See Elizabeth Crouch, Elizabeth Radcliff, Janice C. Probst, Kevin J. Bennett and Selina Hunt McKinney’s April 2, 2019, article, “Rural-Urban Differences in Adverse Childhood Experiences across a National Sample of Children,” in The Journal of Rural Health.
- Again, see our Aug. 15, 2024, On the Economy post examining disconnected young adults by race and geography.
- The CPS queries U.S. households and is conducted jointly by the Census Bureau and the U.S. Bureau of Labor Statistics.
- This report extends the period that our dataset covers through June 2024, which is why some estimates may vary slightly from those in past analysis.
- The white, Black and “other” racial groups are those CPS respondents identifying as non-Hispanic. The Hispanic group comprises respondents identifying as Hispanic or Latino regardless of race.
- This is a standard way to define newer workers. Potential work experience captures new labor force entrants and ranges from zero to 10 years. It reflects factors like age minus years of schooling.
- Although March 2020 is generally considered the start of the pandemic in the U.S., the full impact of COVID-19 on employment isn’t wholly reflected in that month’s data, so it has been excluded from the early pandemic period.
- For more on conditions during this first phase, see our July 14, 2022, On the Economy post, “What Does the Beveridge Curve Tell Us about the Labor Market Recovery?”