


Educational Attainment of Immigrants at the National and Eighth District Levels
KEY TAKEAWAYS
- Educational attainment data cast light on potential contributions by immigrants to the U.S. and Eighth District economies.
- At the two poles of educational attainment for the U.S.—“no high school degree” and “graduate degree”—the immigrants’ share exceeds the natives’ share.
- Although the current foreign-born population largely lags U.S. natives in education and income nationally, that’s not the case for the St. Louis area.

Information about educational attainment of immigrants is helpful in understanding their potential contributions to the U.S. economy.
Immigrants with higher educational levels are likely to earn higher incomes and pay more in taxes, while relying less on subsidized health care and welfare programs and representing a lower fiscal burden at the state and national levels.
To cast light on this subject, this piece looks at the educational attainment of the current foreign-born population in the U.S. and compares it with that of the native-born—nationally and in the four largest metropolitan statistical areas (MSAs) in the Federal Reserve’s Eighth District: St. Louis; Little Rock, Ark.; Memphis, Tenn.; and Louisville, Ky.The states in the District include Arkansas, Illinois, Indiana, Kentucky, Mississippi, Missouri and Tennessee. We note that only parts of some of these states belong to the Eighth District. For example, Chicago is not part of the District. However, given data limitations, in Figure 1 we report the information for the entirety of all seven states.
Educational Attainment
The first four sets of bars in the figure below show significant differences in educational attainment between U.S. natives and immigrants. For the purpose of this article, we use the terms “immigrants” and “foreign-born” interchangeably and reference data from the 2018 American Community Survey (ACS) for the foreign-born population living in the U.S. These data, collected annually by the Census Bureau, include all immigrants, even those who are naturalized citizens.We note that undocumented immigrants are undercounted in ACS surveys, and our calculations may not accurately represent the extent of low-skilled and low-wage immigration.
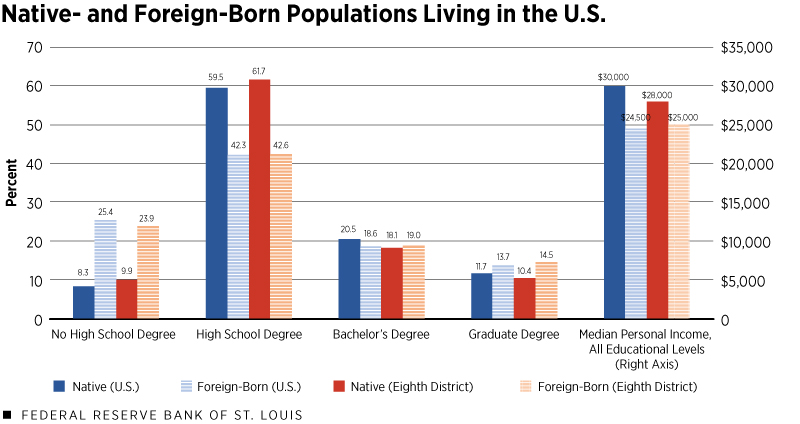
SOURCE: 2018 American Community Survey, accessed via IPUMS USA.
It is important to recognize that the age composition of the native-born population differs sharply from that of the foreign-born. This is because youth immigration is relatively uncommon, and most people who migrate internationally are of working age. The same age distribution trend is reflected in our data: While around 30% of the U.S. native-born population is younger than 22, only about 10% of the foreign-born population is in the same age group. To account for this, our calculations include only individuals who are 22 years old or older.
What’s in the Data
At the national and District levels, the shares of foreign-born people without a high school degree are much larger compared with the corresponding shares for the native population. Conversely, at the high school level, the native shares far outstrip the foreign-born shares.
Indeed, for the U.S. as a whole, the “no high school” and “high school” category differences between natives and immigrants largely offset each other, such that the shares of natives and immigrants with a high school degree at most are similar at about 68%.
This means that the educational attainment level above high school graduation for immigrants and natives is comparable at around 32%. As we move up the educational ladder, slightly higher proportions of the foreign-born hold graduate degrees compared to the natives, nationwide and in the District states.
These educational attainment comparisons suggest that the proportion of foreign-born people at the lowest educational level is relatively high. This would likely lower the average incomes of the immigrants compared with the natives. This is perhaps why we find that, at the national level, the native-born population earns a much higher median personal income ($30,000) relative to that of the foreign-born ($24,500). This difference persists, albeit at a lower magnitude, in the District.
MSA Level
Immigrants are likely to be attracted by large cities for a variety of reasons, including economic and social factors. Accordingly, the table below focuses on the four largest Eighth District MSAs and also the Chicago MSA, with the latter serving as an external frame of reference.
| Highest Educational Attainment | Median Personal Income | |||||||||
|---|---|---|---|---|---|---|---|---|---|---|
| No High School Degree | High School Degree | Bachelor's Degree | Graduate Degree | |||||||
| Native-Born | Foreign-Born | Native-Born | Foreign-Born | Native-Born | Foreign-Born | Native-Born | Foreign-Born | Native-Born | Foreign-Born | |
| Chicago | 6% | 25% | 53% | 43% | 25% | 19% | 15% | 13% | $35,000 | $26,000 |
| Little Rock | 8% | 19% | 61% | 50% | 19% | 15% | 11% | 15% | $30,000 | $22,000 |
| Louisville | 9% | 23% | 61% | 40% | 19% | 20% | 11% | 17% | $30,100 | $25,000 |
| Memphis | 10% | 30% | 62% | 33% | 18% | 20% | 10% | 18% | $26,100 | $23,300 |
| St. Louis | 8% | 10% | 59% | 38% | 20% | 27% | 13% | 24% | $32,000 | $32,000 |
| SOURCE: 2018 American Community Survey, accessed via IPUMS USA. | ||||||||||
Compared with the foreign-born, U.S. natives in the Eighth District have a much higher proportion of people who have attained at least a high school degree. The St. Louis MSA is an exception, where the proportion of the foreign-born without a high school degree is very similar to that of the native population.
The relatively high educational attainment of the foreign-born group in the St. Louis MSA is consistent with the fact that it is the only MSA in the table in which the foreign-born earn just as much as U.S. natives in terms of median personal income. On a related note, the foreign-born in the St. Louis MSA also have the highest median personal income among all the foreign-born populations of the MSAs presented in the table.
Conclusion
Important differences exist in the educational attainment of U.S. natives and immigrants. Interestingly, at the two poles of educational attainment for the U.S.—“no high school degree” and “graduate degree”—the immigrants’ share exceeds the natives’ share. This could reflect demand-side factors such as the need for the U.S. to fill highly skilled jobs and also jobs that require manual labor.
While the Eighth District largely mirrors the nation, important differences are visible at the more granular level of District MSAs, most notably in the St. Louis MSA, where immigrants display relatively high educational attainment and income levels.
Endnotes
- The states in the District include Arkansas, Illinois, Indiana, Kentucky, Mississippi, Missouri and Tennessee. We note that only parts of some of these states belong to the Eighth District. For example, Chicago is not part of the District. However, given data limitations, in Figure 1 we report the information for the entirety of all seven states.
- We note that undocumented immigrants are undercounted in ACS surveys, and our calculations may not accurately represent the extent of low-skilled and low-wage immigration.


Views expressed in Regional Economist are not necessarily those of the St. Louis Fed or Federal Reserve System.
For the latest insights from our economists and other St. Louis Fed experts, visit On the Economy and subscribe.
Email Us